Transit riders know that all delays are not created equal. On one end of the spectrum there are those five-minute midday hiccups that hardly pose a problem for savvy straphangers. On the other, there’s the dreaded signal malfunction at rush hour—or, as Washington commuters know all too well, the possibility of a complete shutdown.
The media’s emphasis on such major failures—the day-long Metro closure, the indefinite shutdown of part of a BART line, or the inability of Boston’s T to function during a heavy winter—risks overlooking more workaday questions of transit systems’ basic performance. What do success and failure look like when it comes to the day-to-day functions of a transit agency? From whose point of view is good performance being measured?
It turns out that the answers to these questions vary significantly from city to city, or even between different parts of a single transit agency. In a recent report, the New York State Comptroller encouraged the Metropolitan Transportation Authority to do some soul-searching about how it measures performance in the country’s busiest transit system, and challenged New York’s transportation leaders to move away from outdated metrics toward new ones that can better serve the public.
At the moment, the MTA and many other agencies tend to use indicators of success that reflect the concerns of the people who actually run subway or other systems. These include on-time performance and the average distance a train car travels between mechanical problems.
But those measurements might not actually indicate whether the agency is delivering good service to riders. For example, regarding subway delay, the MTA relies heavily on a performance metric known as “wait assessment,” defined as the percentage of train arrivals that cause passengers to wait at least 25 percent longer than expected.
Wait assessment has two major problems. First, it is not obvious what it means to have a “good” wait assessment score. If the A train has a wait assessment score of 85 percent, what does that mean for riders? Second, wait assessment is indifferent to how late a train is or how many riders are affected by its lateness. On a line with service every four minutes, a gap of six minutes between trains in the Bronx at 6 A.M. is equally as “bad” as a gap of 15 minutes between trains passing through Grand Central at rush hour.
As documented in great detail by the International Bus Benchmarking Group (IBBG), a consortium dedicated to tracking the performance of urban bus transit worldwide, there is already a performance metric that does a much better job than wait assessment. It’s called excess wait time, or EWT for short.
EWT measures how much extra time passengers wait for a train or bus compared with the ideal scenario of every vehicle running at scheduled frequencies. This gives it major advantages over wait assessment.
For starters, EWT records delay in minutes rather than as a percentage, which captures the problem of delay for riders much more accurately and intuitively. As a result, long gaps in service that cause big rider delays are weighted more heavily than small delays. Additionally, EWT weights delay by the number of people affected, so a service problem during rush hour counts as a bigger negative than an equivalent service delay on Sunday morning.
MTA New York City Transit (NYCT) happens to be a member of IBBG, which has publicly endorsed the adoption of EWT as a bus reliability metric. NYCT has not adopted this metric, however, and reports bus reliability statistics twice per year for 42 routes of the hundreds that the agency operates. No bus reliability metrics are listed as indicators for “providing on-time and reliable services” in the agency’s most recent Mission Statement, Measurements, and Performance Indicators Report.
EWT isn’t just better for riders. Transit agencies know as well as anyone that long delays are a bigger problem than short ones. So when agency divisions or staff are given performance evaluations, it’s fairer to them to do so on the basis of EWT than the arbitrary 25 percent threshold inherent in wait assessment.
One American transit agency taking the lead on performance measurement is the Massachusetts Bay Transportation Authority (MBTA), Boston’s regional transit operator. The MBTA has expanded its open data efforts since 2008, and since 2014 has boasted a fully standardized real-time data system.
The MBTA continues to improve its data offerings, recently moving toward an EWT-type approach. Here’s what the agency has to say about it on its recently launched data blog:
So why do we go through all this trouble? Because it allows us to more accurately reflect our passengers’ experiences on the MBTA by weighting performance by the number of passengers affected. Taking into account the fact that people arrive at different times between trains and are not equally affected by gaps in service, as well as the variations in demand from station to station and hour to hour over the course of the day, results in a more comprehensive and nuanced reliability metric for subway service. This metric reflects the true passenger experience in the best way we currently can.
The MBTA isn’t just using good data—it’s publishing it in an easy-to-use format. Among the agency’s ongoing projects is a new, first-of-its-kind application programming interface (API) for performance measurement that the the MBTA’s own Dominick Tribone demonstrated at Transportation Camp New England last month.
The agency is poised to go a step further by eventually publishing the code for the software that underlies these analyses on its own GitHub page (currently empty, but that will change in the coming months) so that agencies around the world can learn from the MBTA’s approach.
TransitCenter is providing ongoing support for the development of a similar API to analyze the reliability of New York City’s local bus network. Software developers can already access this resource, which also allows users to explore EWT for bus routes across the city. The API shows how transit agencies and independent developers alike can build valuable tools—provided high-quality open data exists in the first place.
Transit agencies can’t manage what they don’t measure, so what they do measure has a big impact on how they end up managing. Analyzing EWT internally and reporting performance transparently are two ways transit operators can show that they are serious about providing reliable service to meet their customers’ needs.
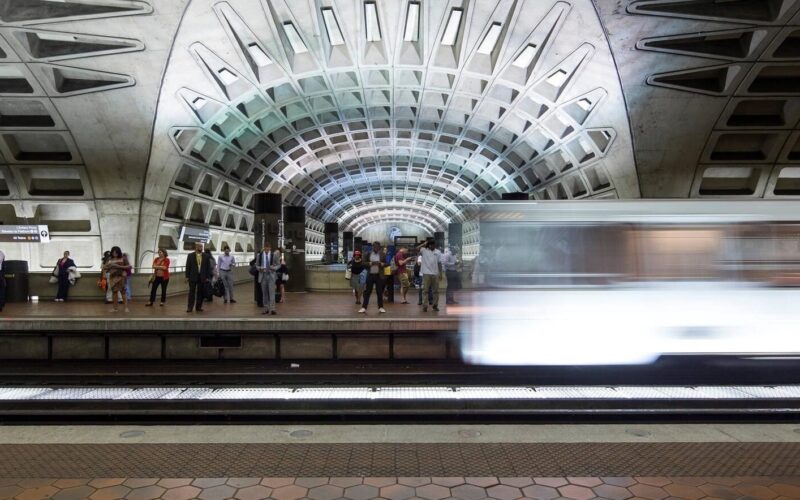 On the Brink: Will WMATA’s Progress Be Erased by 2024?
The experience of being a WMATA rider has substantially improved over the last 18 months, thanks to changes the agency has made like adding off-peak service and simplifying fares. Things are about to get even better with the launch of all-door boarding later this fall, overnight bus service on some lines starting in December, and an ambitious plan to redesign the Metrobus network. But all of this could go away by July 1, 2024.
Read More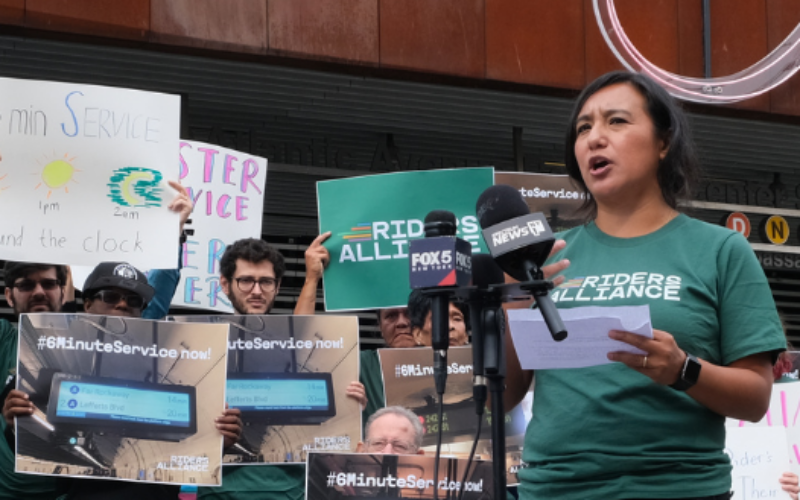 Built to Win: Riders Alliance Campaign Secures Funding for More Frequent Subway Service
Thanks to Riders' Alliance successful #6MinuteService campaign, New York City subway riders will enjoy more frequent service on nights and weekends, starting this summer. In this post, we chronicle the group's winning strategies and tactics.
Read More