

In our recent post highlighting a few of the important opportunities created by the MTA’s open data program, we promised an update when a tool called BusVis was published. That day has come: BusVis — built by six master’s students at the NYU Center for Urban Science and Progress (CUSP) with support from their advisor, Huy Vo — is the first public visualization we’ve seen that uses a historical archive of the MTA’s Bus Time data, which tracks buses’ positions along their routes at 30-second intervals. The MTA has published for every bus route in the city since March 2014 (the MTA piloted the system on the B63 bus route beginning in January 2011, and expanded from there).
BusVis presents CUSP’s analysis of MTA buses’ speed along each route in the system, allowing users to understand this measure of performance according to route direction, stop pattern, and time of day. The site presents average speeds estimated for the four month September – December 2014 time period.
As reported in Politico NY [paywall] recently, this is a useful tool for bus riders and advocates alike. It is also fitting that the analysis is built on the work of NYC-based graduate students, given the supporting role students also played in getting Bus Time off the ground in the first place.
MTA spokesman Kevin Ortiz also commented on the limitations of using MTA’s Bus Time data alone to analyze the performance of the agency’s buses in New York City, explaining that at the MTA “The reports produced on a daily basis not only use the Bus Time [Automated Vehicle Location] data but refine that data using the [Unified Timekeeping System] pullout data which is not available to CUSP… Without using the UTS data, the Bus Time data on its own cannot correct for operator errors or Bus Time outages.” So while the Bus Time data does create an opportunity for new third-party analyses, those analyses will need to be presented with some important caveats regarding what can and cannot be gleaned from this expansive dataset. Once we have a better understanding of these limitations, we will be able to revisit our post focused on the performance of the M35 bus, for example (we have already updated that post with a comment on one such limitation in response to feedback received on the analysis).
In the meantime, we remain excited about the potential for leveraging this amazing resource to gain insight about the city’s public transportation system, and we hope the MTA’s continuously growing open data archives inspire other transit agencies around the world to follow suit.
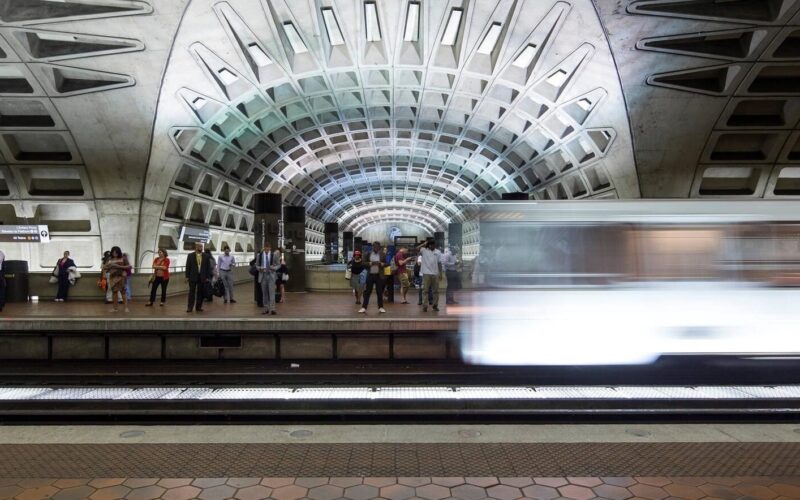 On the Brink: Will WMATA’s Progress Be Erased by 2024?
The experience of being a WMATA rider has substantially improved over the last 18 months, thanks to changes the agency has made like adding off-peak service and simplifying fares. Things are about to get even better with the launch of all-door boarding later this fall, overnight bus service on some lines starting in December, and an ambitious plan to redesign the Metrobus network. But all of this could go away by July 1, 2024.
Read More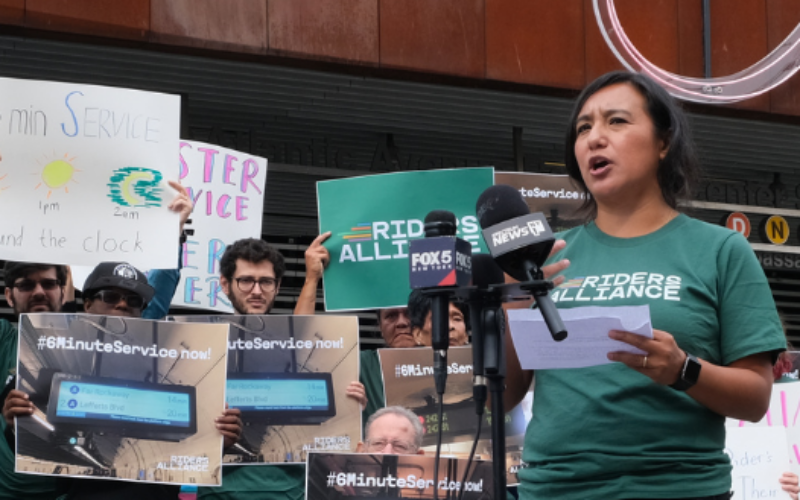 Built to Win: Riders Alliance Campaign Secures Funding for More Frequent Subway Service
Thanks to Riders' Alliance successful #6MinuteService campaign, New York City subway riders will enjoy more frequent service on nights and weekends, starting this summer. In this post, we chronicle the group's winning strategies and tactics.
Read More