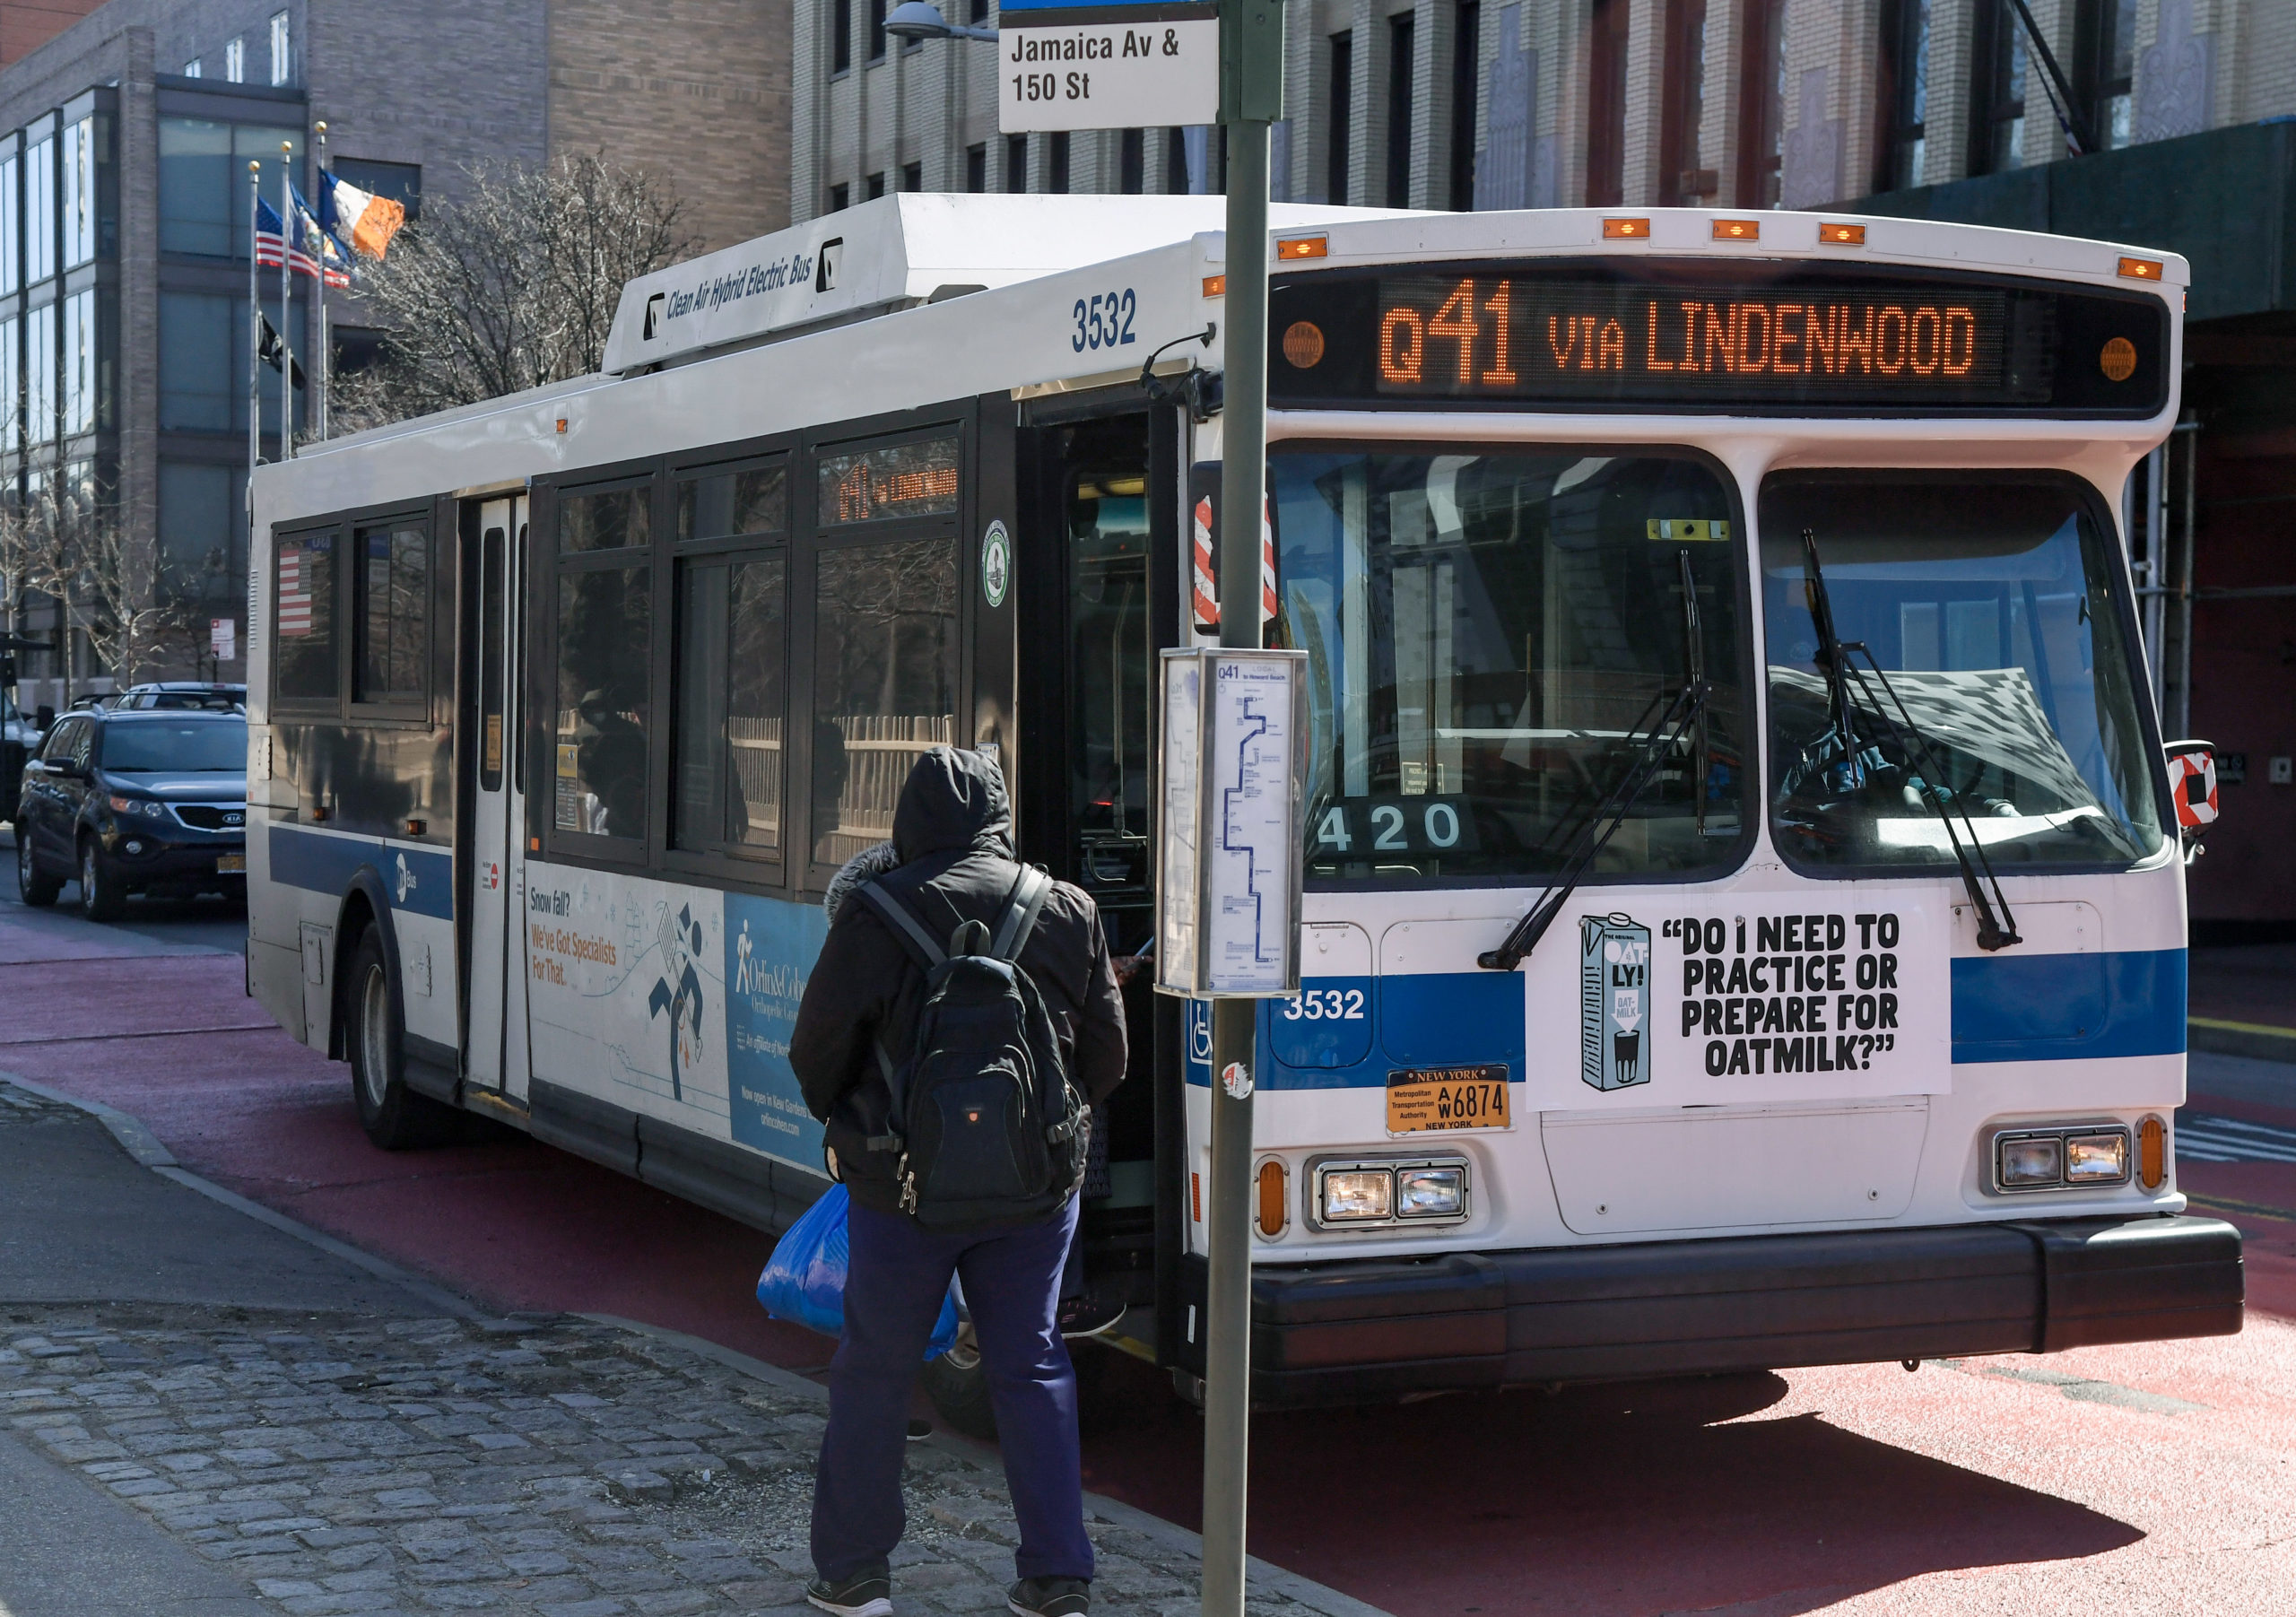
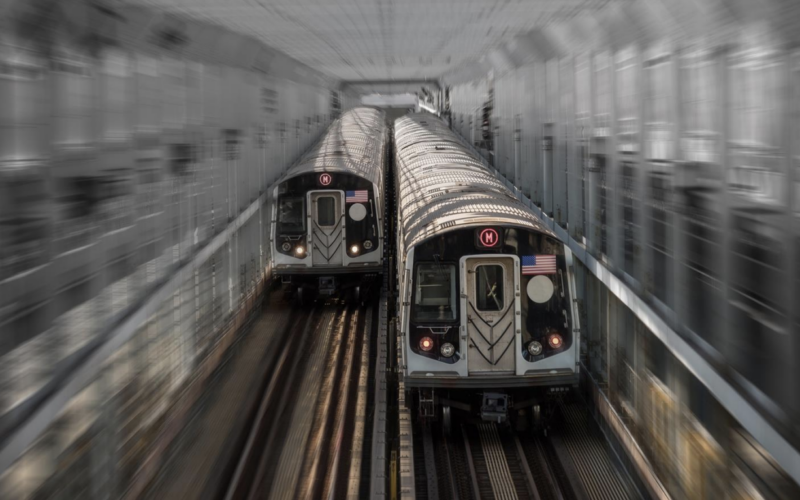
Photo credit: Metropolitan Transportation Authority of the State of New York
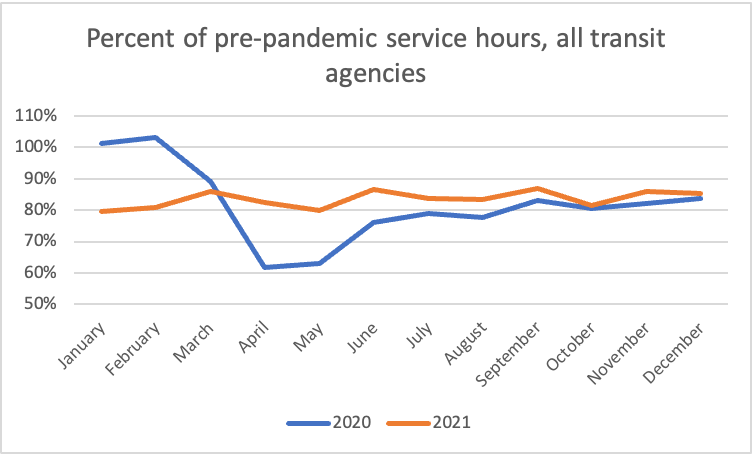
Throughout 2021, transit service levels across the country fluctuated in response to COVID-19 waves and workforce availability. Nationwide, service levels in 2021 maintained an average of 83% of pre-pandemic service, bottoming out in May at 80% and peaking at 87% in June and September. Concerningly, 2021 ended with nationwide service levels roughly on par with 2020’s year-end.
But while they provide a big picture snapshot, national transit service levels can obscure local trends. In this post, we’re drilling down into 2021 service levels across mode in the seven highest ridership cities to see the choices agencies are making about how to allocate service, as well as to gauge the impact operator shortfalls are having.
All chart data is from the Federal Transit Administration’s National Transit Database (Monthly Module Adjusted Data Release, February 2022. Service data is available through February 2022 but continues to be updated past its initial release–we included data only through December 2021 to ensure accuracy.) The fixed-route surface category consolidates light rail, streetcar, trolley bus, and cable car data. The local bus category consolidates local bus and rapid bus (BRT) data.

Boston: The MBTA has been proactively changing bus schedules since the onset of the pandemic, reallocating service to some high-ridership bus routes that are now running at greater than 100% of pre-pandemic service. Agency staff said in Fall 2021, “When we bring service back…the system will look different and I think that’s because like many public agencies, we have learned a lot about who and how folks rely on transit and who and how well we are serving people or not serving people and make sure as travel patterns change…that the T is evolving.”
As with other transit agencies, the MBTA struggled in late 2021 with workforce shortfalls that impacted its capacity to operate planned service increases. After learning that it was dropping 5% of bus trips due to operator availability challenges, the agency reduced its planned service so that service could be more reliable and predictable for riders.

Chicago: While CTA has offered relatively reliable service throughout the pandemic–even winning an APTA award for its COVID-related service efforts in 2020–it too began to struggle with workforce shortage challenges later in the year. In December, CTA began communicating operator availability as the source of delays and less frequent service, as service levels on both bus and rail dropped significantly in November and December. While Omicron was as much a challenge in Chicago as it was throughout the rest of the country, ATU Local 241 President Keith Hill has also started to call for improved hiring and training rates.

Los Angeles: Despite some ups and downs, LA Metro’s service levels generally trended upward in 2021. The agency’s major development was the continued implementation of the NextGen Bus Plan, which LA Metro had begun planning pre-pandemic. In June 2021, the agency decided to forge ahead and implemented the new network, but experienced hiccups with the roll-out and eventually struggled to deliver the promised service improvements due to a shortfall of operators.

New York City: The NYC area–led by New York City Transit–weathered the pandemic relatively well in 2021. In May, the agency restored the overnight subway service that had been suspended for nearly a year. Like many operators, NYCT struggled with COVID-related absences toward the end of the year amidst the Omicron surge, causing local bus and subway service to drop as much as 5% from November to December.
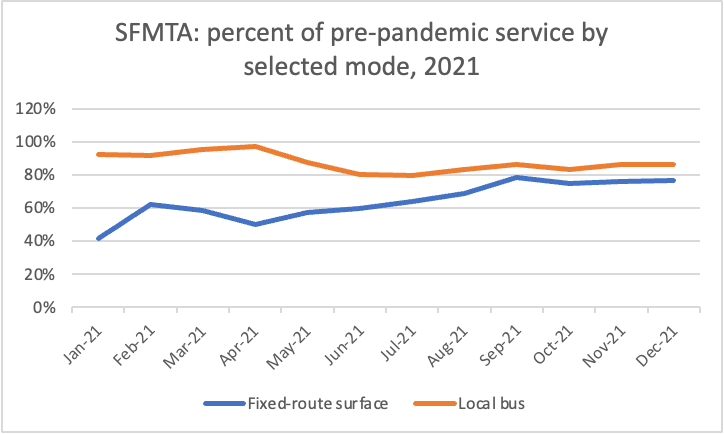
San Francisco: In 2020, SFMTA delivered some of the lowest levels of service among large transit agencies due to funding uncertainty and mechanical challenges in delivering rail service; to compensate, the agency concentrated service along the highest-need routes. That trend continued in 2021, as both bus and rail service continue to hover around 80%. In its Meeting the Moment annual report, the agency expressed its intent to return to 85% of pre-pandemic service in 2022.
As the San Francisco Chronicle reported, “The agency initially planned to make all of these restorations…in late February [2022]. A persistent shortage of operators and subsequent Omicron surge, however, have pushed back the timeline twice.”
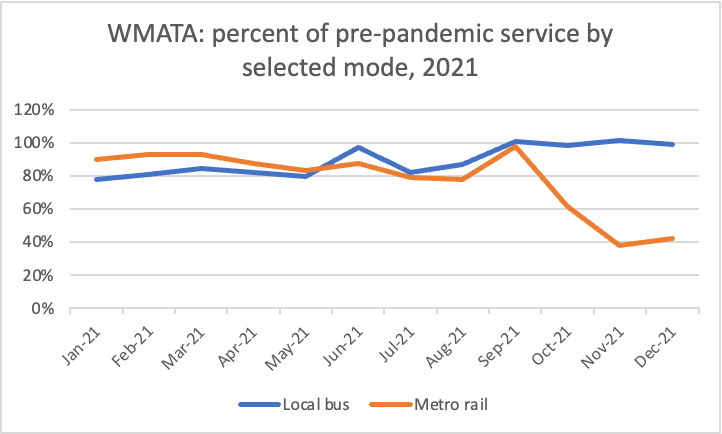
Washington DC: WMATA had one of the most challenging 2021s among large transit agencies. After maintaining relatively low service levels longer into the pandemic compared to peer operators, WMATA implemented an ambitious, full service restoration in September 2021. While the agency’s bus routes have continued to operate at pre-pandemic service levels, mechanical concerns on the 7000-series train cars following an October derailment have forced WMATA to more than halve its train service. As of December 2021, rail service was operating at around 40% of pre-pandemic service.
COVID and particularly the Omicron variant has also impacted WMATA’s service delivery. In January and February 2022, WMATA was forced to operate bus service on weekend schedules due to covid-related operator absences. The agency also introduced hiring bonuses in an attempt to hire as many as 70 new operators.

Philadelphia: SEPTA maintained relatively high local bus and metro rail service hours in 2021, with local bus only really tailing off in December amidst the omicron surge during which time 145 operators were out at a given time. In January 2022, this tally grew to as many as 600 operators absent one week.
The agency announced in August 2021 that overall service would reach 93% of pre-pandemic service in September; however, this level of service is not reflected in the reported data (showing 85% of pre-pandemic service in September), suggesting that regional (commuter) rail data was perhaps not included in the communicated service restoration. Importantly, SEPTA and the Transport Workers Union (TWU) Local 234 ratified a two-year contract in November 2021, avoiding a threatened work stoppage. Among wage increases and other improved benefits for workers, the contract also included a pandemic hazard pay bonus of up to $2,200 per employee.
Note: The May-June spike in fixed-route surface service is due to a significant service reduction in May-June 2019–against which the data is standardized–when “a cruel convergence of planned maintenance” and a sinkhole nearly halved trolley service hours.
 Surmounting the Fiscal Cliff: Identifying Stable Funding Solutions for Public Transportation Systems
Urban Institute's latest report, "Surmounting the Fiscal Cliff," seeks to understand why transit agencies—unlike many other public services—continuously face fiscal instability.
Read More LA is (Not-So) Quietly Adding a LOT of Bus Lanes
Thanks to the persistent work of local transit advocates, LA Metro is laying down 30 miles of bus lanes in 2023, pushing the total number of bus lanes in LA County to 40 miles.
Read More