When COVID-19 struck U.S. cities this March, transit agency revenue plummeted, transit worker availability was curtailed to protect their health, and riders were urged to travel only for essential trips. In response, most transit agencies reduced service, often by switching to weekend schedules seven days a week.
These schedule changes may have made sense as stopgap measures, but they fall short as an extended response to COVID-19 conditions, because transit ridership has not changed uniformly within transit networks.
Throughout the pandemic, millions of predominantly Black, brown, and low-income workers continued to commute to essential jobs on transit. Transit use has generally remained higher in low-income neighborhoods and neighborhoods of color.
Weekend schedules were handy for agencies looking to make quick adjustments, but not responsive to these changes in travel. In many cities, some routes retained much more ridership than others. Service cuts that didn’t account for this variation saddled many essential workers with long waits for dangerously crowded vehicles.
Understanding how service should adapt to changing travel patterns requires looking beyond aggregate commuting data to instead examine route- and stop-level shifts in ridership. In the Boston region, the MBTA shared datasets on bus ridership that make this analysis possible.
Using the MBTA’s automated passenger counter (APC) bus data and 2015-2017 Passenger Survey, we can look at how ridership levels are shifting on each bus route, and cross-reference that information with demographic data on race and income.
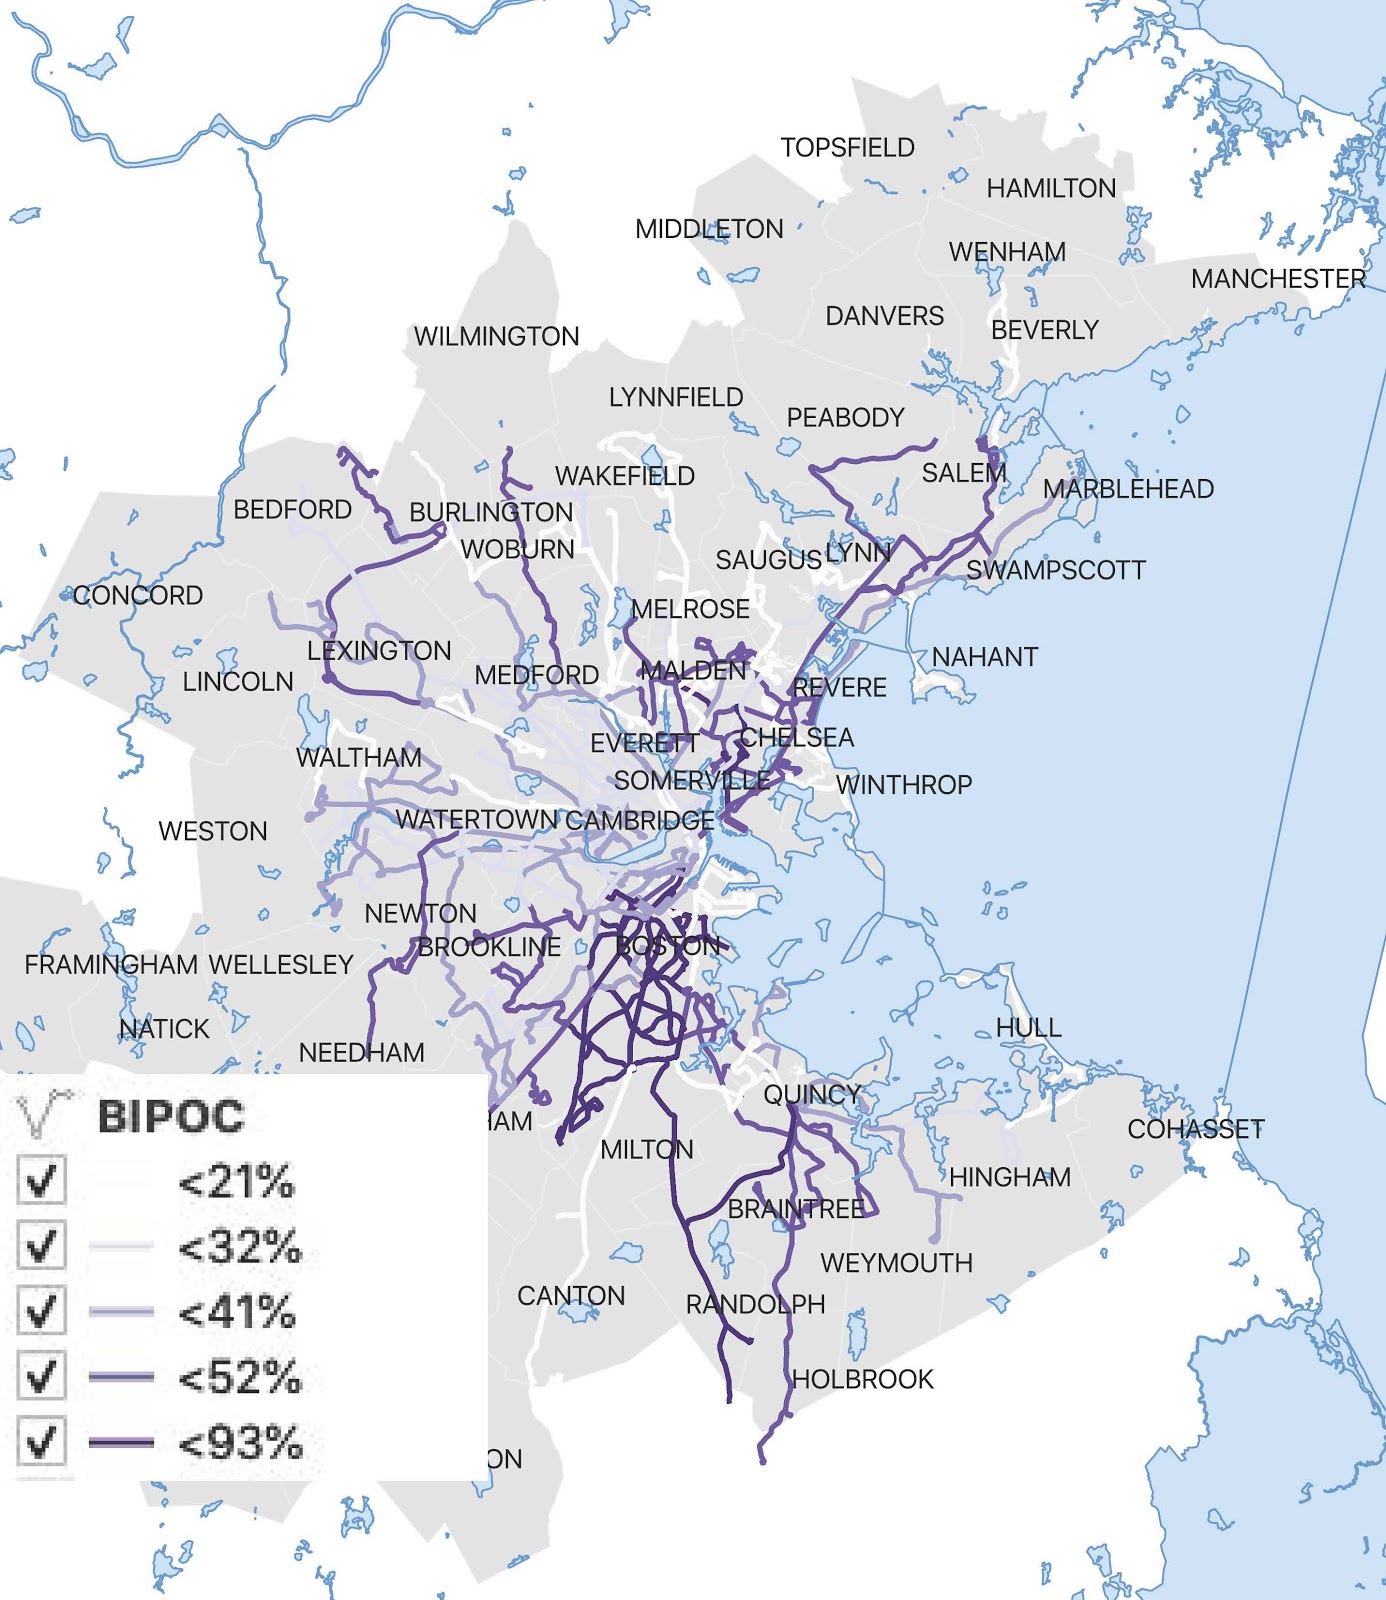
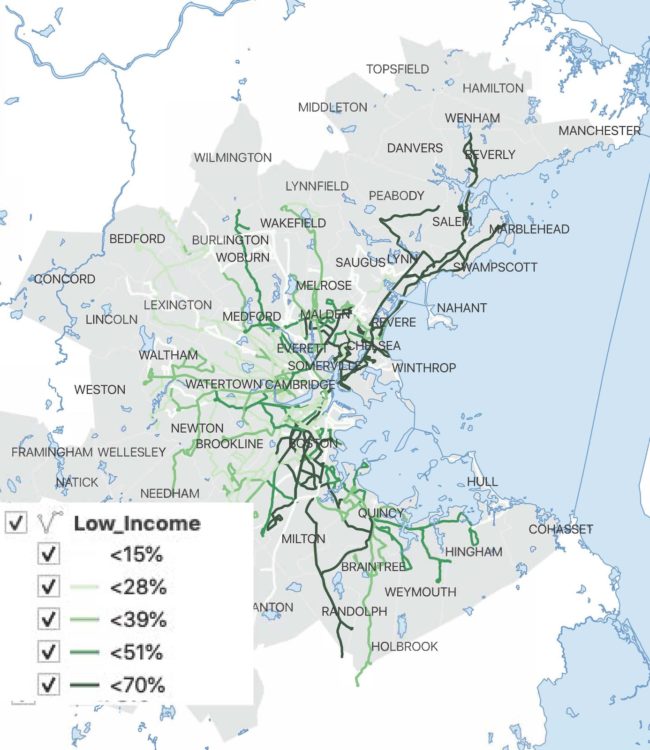
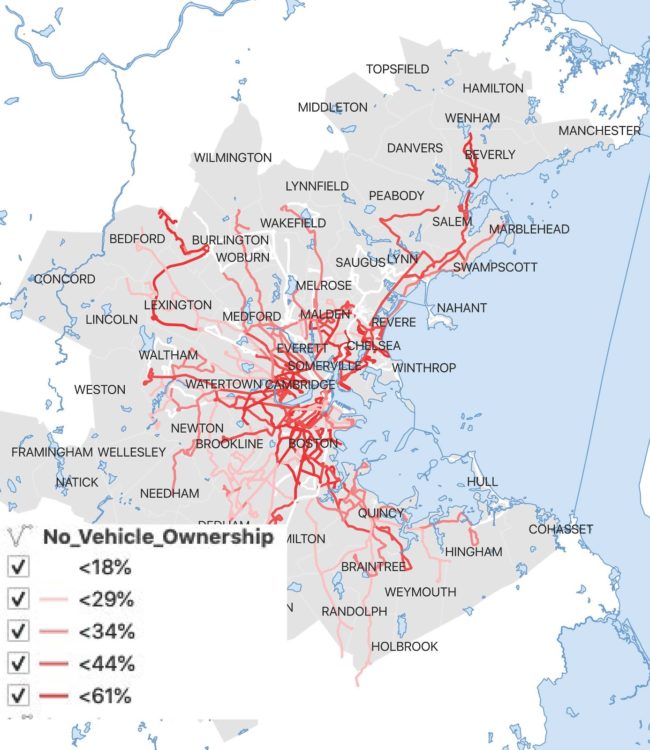
In the maps below, the darker routes have a higher percentage of riders who identify as low-income (top) or BIPOC (middle), or own no personal vehicle (lowest). A similar pattern emerges in all three, with the darkest routes concentrated along a roughly north-south axis emanating from the Boston core.

As we’ll show in this post, these are also the areas that have tended to retain the highest share of ridership. The implications are clear: To meet the needs of people who have been most affected by the pandemic, agencies should go beyond the initial transition to weekend schedules and adapt service in response to shifting travel patterns.
While the data for this analysis came from the MBTA — which has continued to adjust service after the initial switch to Saturday schedules — the general principle applies to transit agencies throughout the U.S. where Black, brown, and low-income riders account for a greater share of ridership today than before the pandemic struck.
For the ridership analysis, we made two comparisons. The change in weekday trips in spring 2019 versus spring 2020 illustrates how travel shifted as a result of the pandemic. And comparing Saturday trips in fall 2019 to weekdays in spring 2020 suggests that a “standard” weekend schedule does not align with riders’ current needs.
How bus use shifted from spring 2019 to spring 2020
During the peak of the pandemic, in early spring, MBTA weekday bus ridership fell to 20% of the previous spring’s levels. But the change was far from uniform. The maps below show stop-level ridership in 2019 (blue dots) against 2020 (yellow dots). Mostly-yellow clusters indicate where bus ridership in 2020 was close to pre-pandemic levels, while blue clusters depict a large decline in ridership.
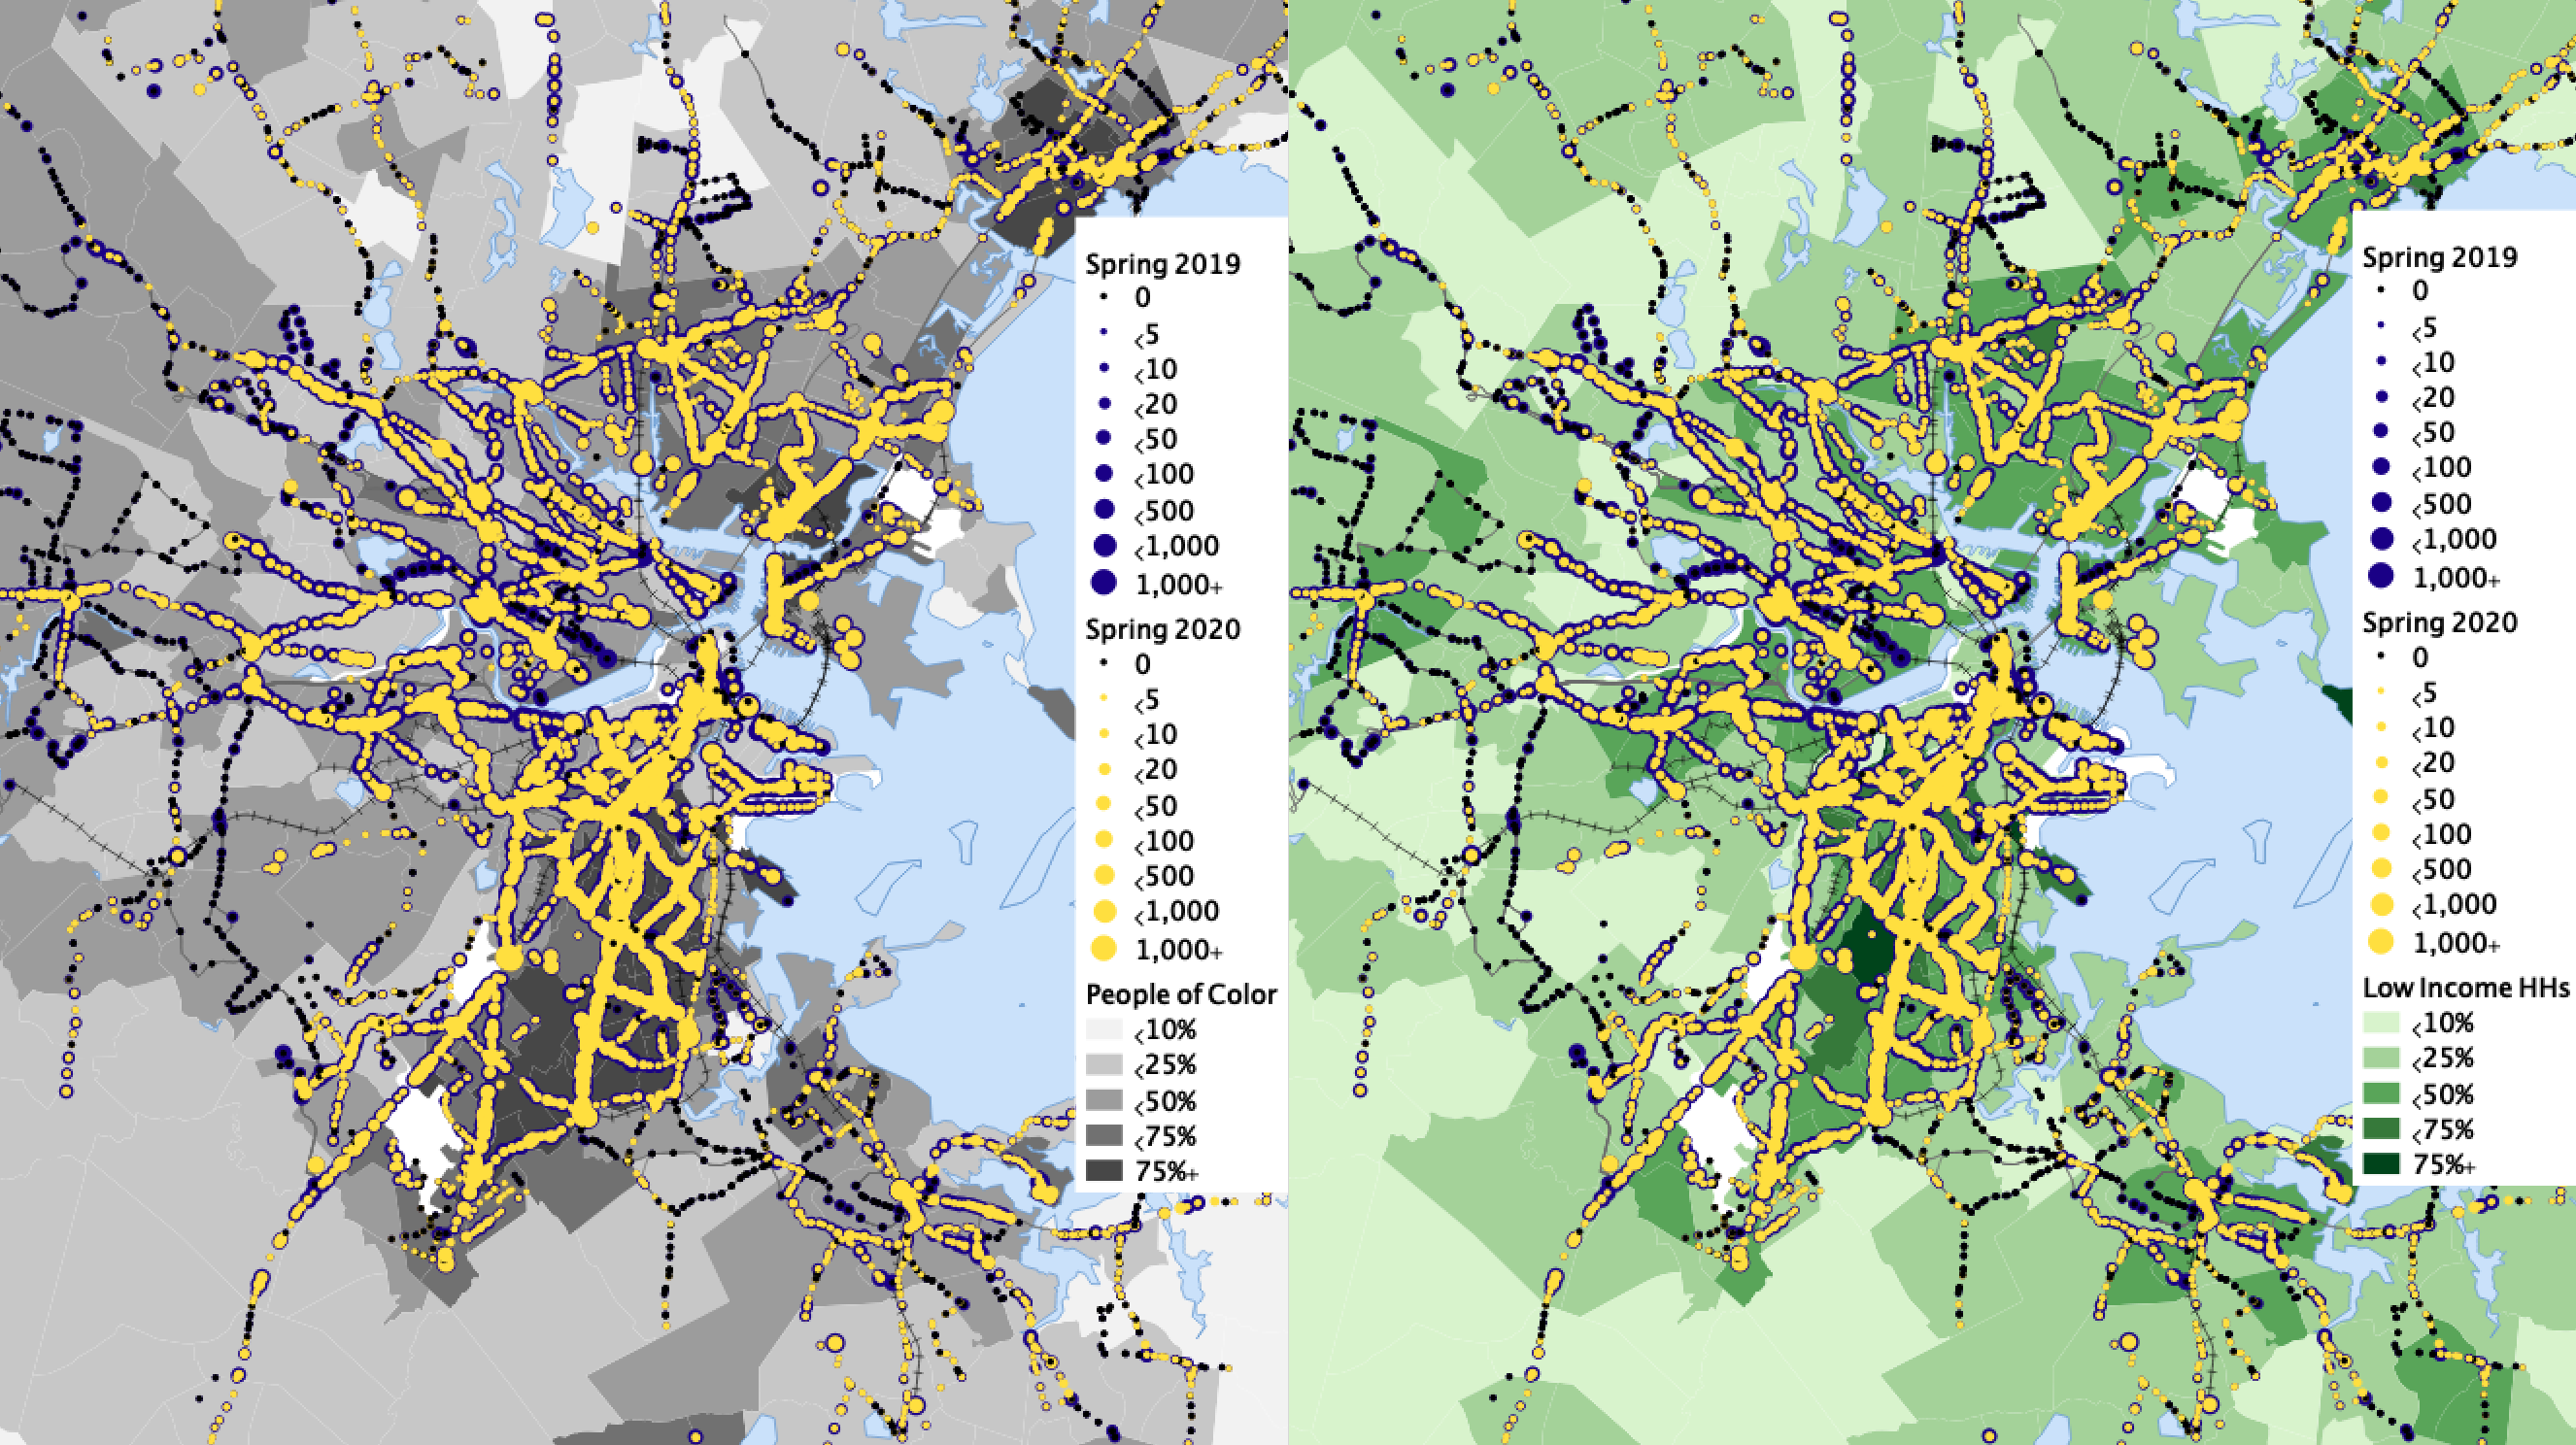
Change in weekday bus stop ridership, spring 2019-2020, mapped against the percentage of residents who identify as people of color (left) and the percentage of residents with low incomes (right).
Acute declines in ridership can be seen in the business, cultural, and university districts immediately surrounding Downtown Boston. Trips also fell precipitously at the bus stops in affluent communities to the north and west of the central city.
Meanwhile, ridership remained high at many bus stops to the south and northeast of Downtown Boston. In working-class towns like Lynn, Revere, and Chelsea to the northeast, residents have few options into the city besides the bus. South of downtown, bus routes retained significant ridership through neighborhoods including Mattapan, Dorchester, and Roxbury, where more than three-quarters of residents are people of color and most households have low incomes.
The maps below isolate the bus stops with the steepest drop in weekday ridership (orange and red), and the stops where ridership actually increased (blue). The biggest decline is mainly concentrated within a few miles of downtown, as thousands stopped commuting to jobs in the area. Bus stops that had more daily riders in 2020 are mostly located on the periphery of the MBTA system. While ridership patterns will continue to shift, this inversion illustrates how service should adapt to downtown’s diminished prominence as a place of work. Schedules that previously emphasized connections to downtown employment may undercut the sustained need for transit service within and across neighborhoods outside of downtown.
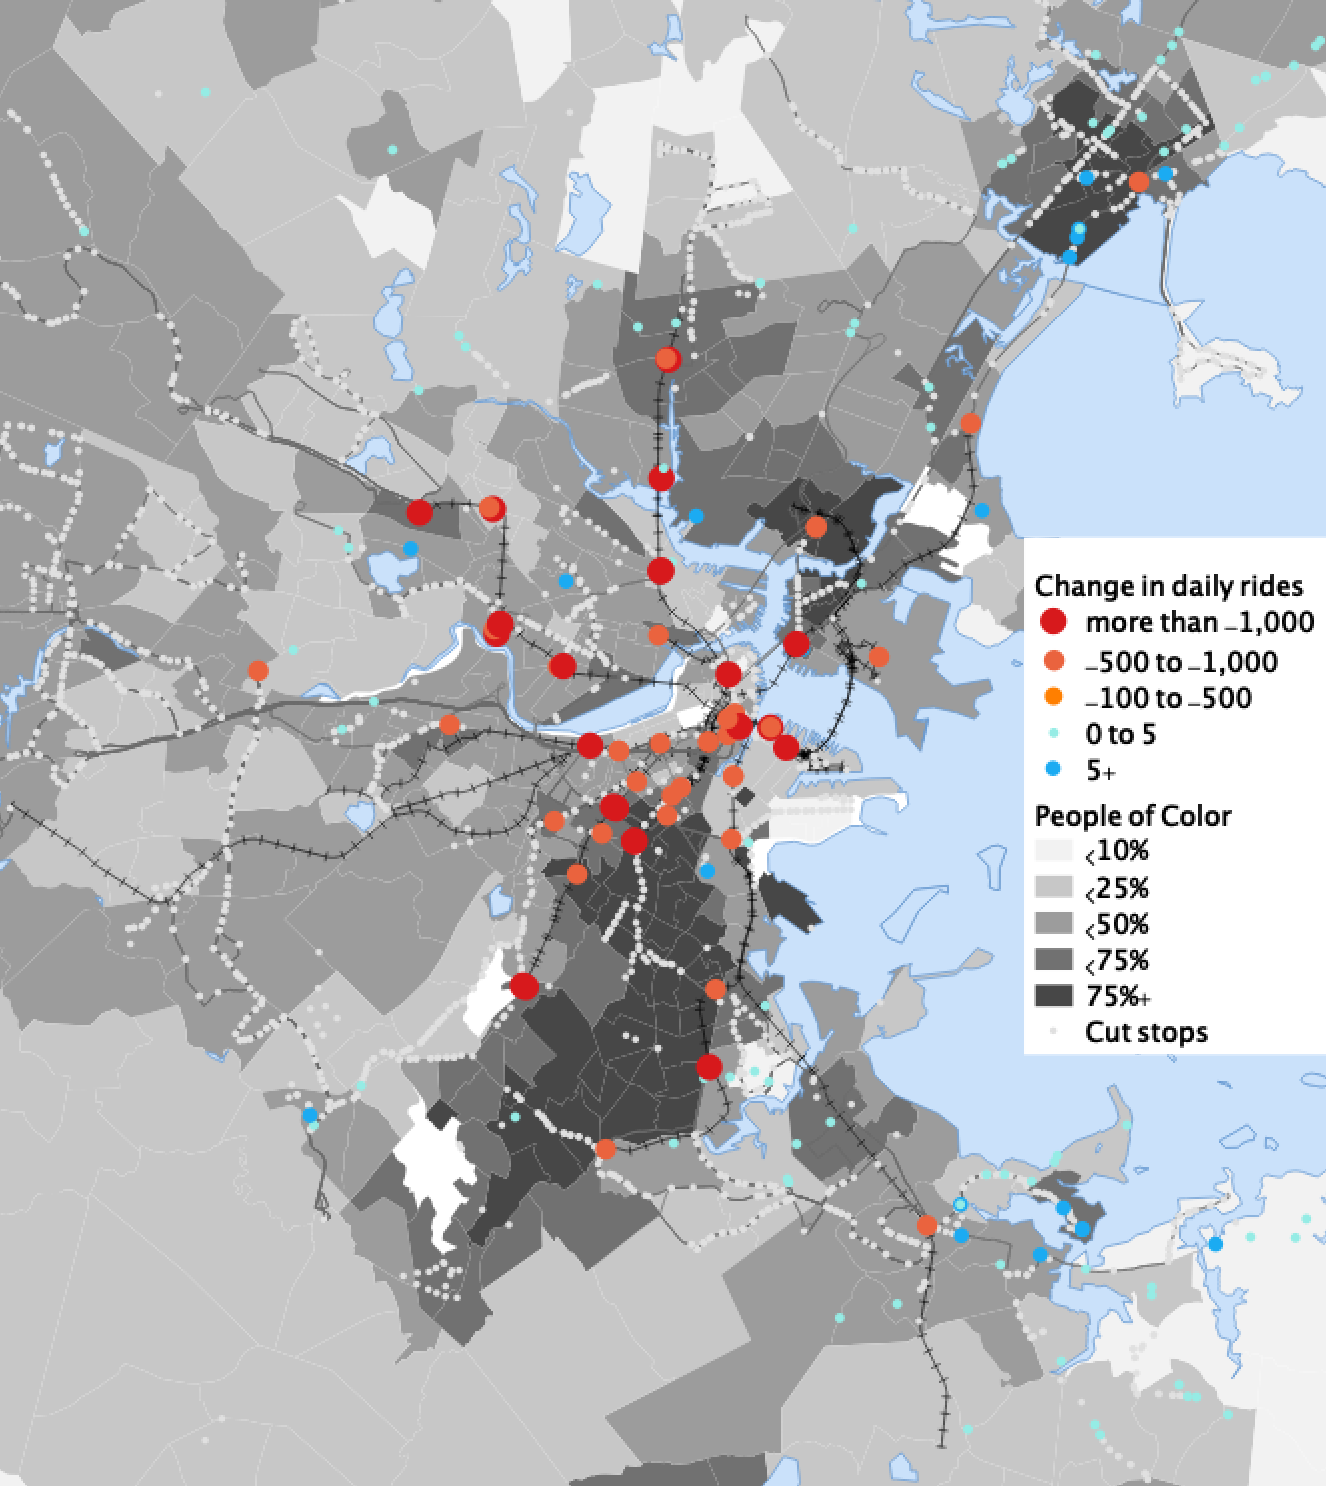
Significant drops and increases in weekday ridership by bus stop, spring 2019 to spring 2020
Another way to visualize these shifts is to look at ridership changes by route. The average MBTA bus route retained 15% of its ridership from spring 2019 to spring 2020, and most routes through affluent western suburbs retained even fewer riders. But high-ridership bus routes that serve communities of color and low-income neighborhoods to the south and northeast retained more than 30% of typical ridership. The routes with the highest ridership retention rate – above 40% – connect suburbs on the periphery to the central city.
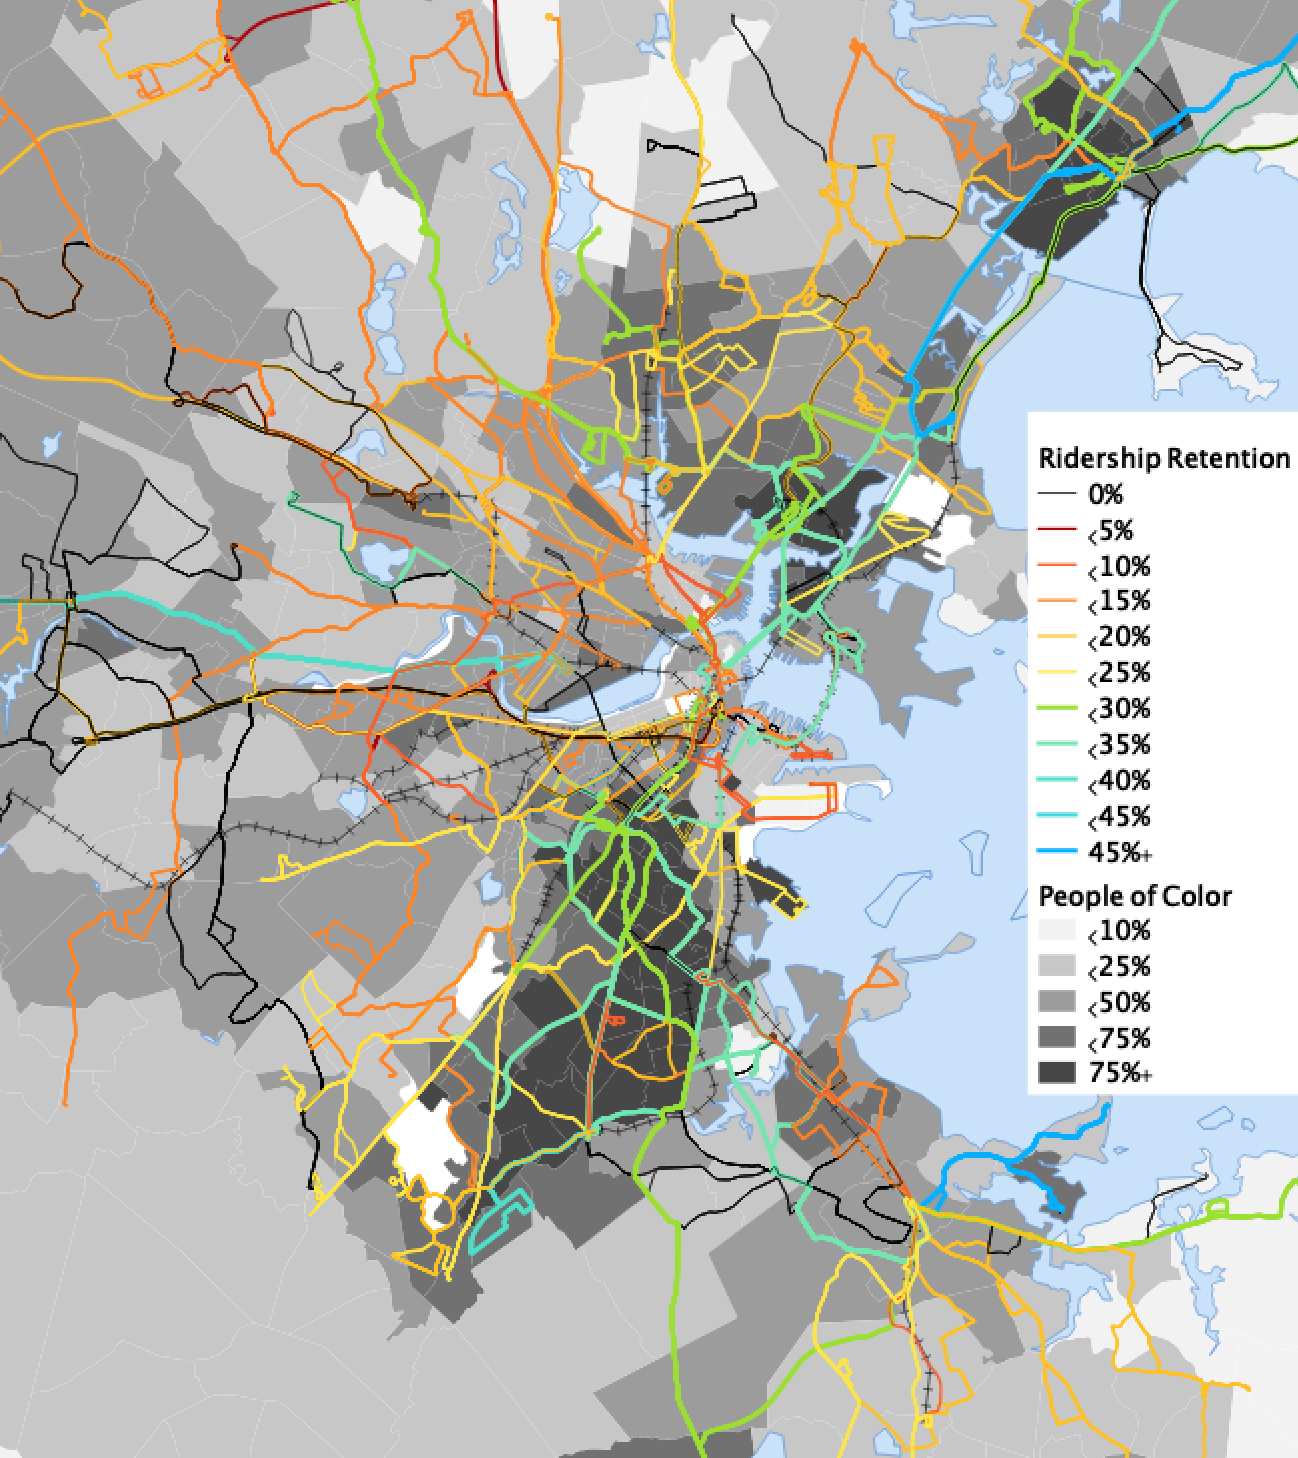
Weekday bus route ridership in 2020 as percentage of 2019 ridership
How well do weekend schedules fit current ridership patterns?
Many transit agencies switched to weekend schedules as an immediate response to the pandemic, opting for ready-made timetables that could be operationalized quickly.
Generally speaking, weekend transit schedules reduce frequency system-wide while emphasizing service to entertainment, cultural, and shopping districts. This is a bad fit for travel patterns during the pandemic, which has depleted activity in those areas. Comparing Saturday ridership patterns from fall 2019 to weekday ridership in spring 2020 provides a good proxy for the mismatch between pre-pandemic weekend schedules and current ridership.
The pattern looks familiar, with weekday bus stop boardings in spring 2020 higher than fall Saturdays in 2019 at hundreds of bus stops concentrated in the suburbs north and south of the central city. Meanwhile, most of the bus stops with the largest drops in ridership are located close to Boston’s downtown, near destinations like Boston Common, Harvard Square, and Fenway Park. Transit service to these venues is much less important than providing regular, all-day connections for employees at essential workplaces and for people who need transit access to routine necessities like food and medical care.
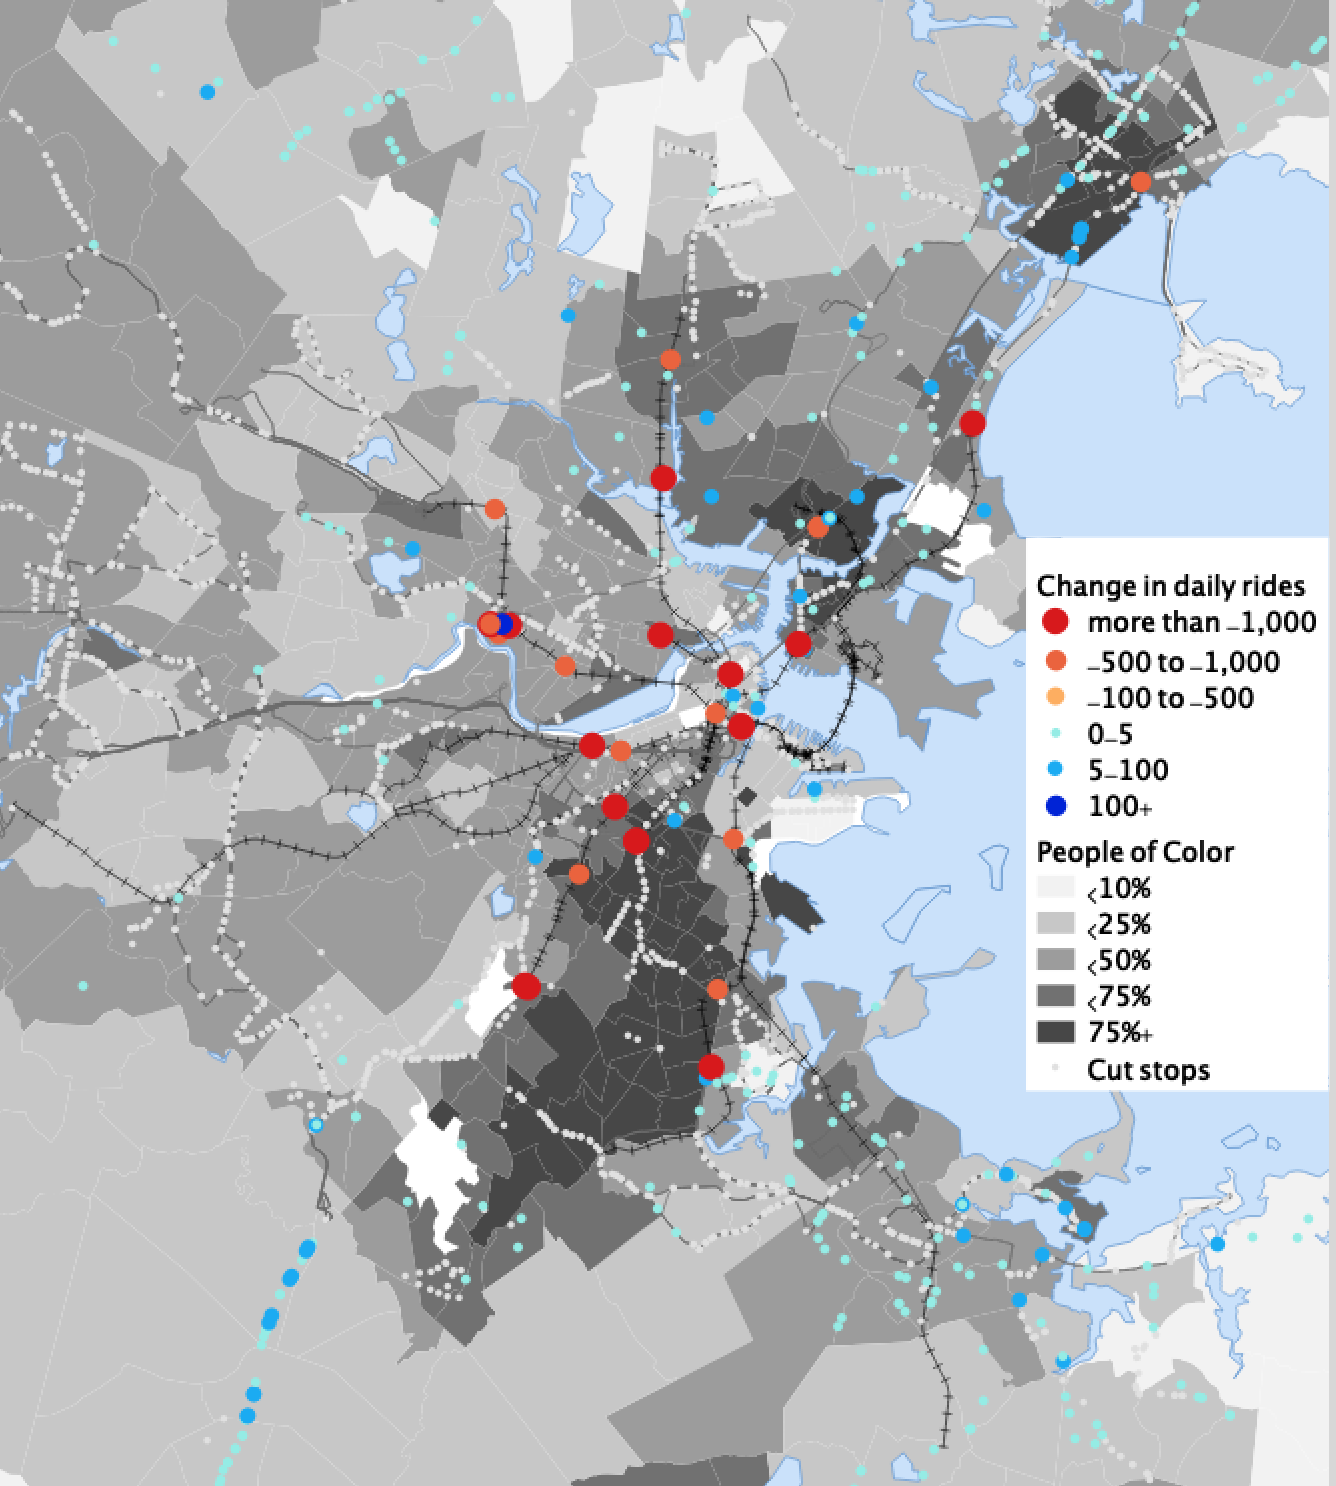
Change in bus stop boardings, fall Saturdays 2019 vs. spring weekdays 2020
Implications for service planning and adjustments
Shifts in transit use since the onset of the COVID-19 emergency have major implications for how agencies plan service going forward. Tweaking schedules once per quarter is unlikely to keep pace with rapid changes to travel patterns. While challenging, multiple agencies, including the MBTA, have devised methods to update schedules more often, based on evolving route-specific needs.
The MBTA made significant and regular adjustments to its baseline service during the pandemic, which was initially derived from the Saturday schedule, once new ridership patterns emerged. And in San Francisco, SF Muni did not fall back on weekend schedules when creating its essential service plan, and continues to iterate route and schedule adjustments even while coping with an ongoing budget crisis. Muni and MBTA both use APCs to understand shifting bus ridership and inform service adjustments. The agencies also turned to community groups and advocates to identify problems riders encounter that aren’t always detected in ridership counts.
Agencies should seek to gain a better understanding of changes to transit travel patterns through rider outreach, surveys, and demographic data analysis, which will help ensure that service changes respond to the needs of essential workers, people of color, and people with low incomes. Passenger surveys can provide an understanding of people’s travel that is both more recent than Census data and more expansive than the limited nature of the Census’s commute-only records. This type of analysis is especially important for agencies to understand who is riding during pandemic conditions, and how to adjust service networks in response.
As long as COVID-19 affects life in cities, service planning must adapt to continued uncertainty. A flexible and nimble approach will be necessary to deliver safe, responsive service, especially for the Black, brown, and low-income riders who have relied on transit the most during the pandemic.
MBTA data and methodology notes:
Data for spring 2019 and 2020 were shared by MBTA staff. They represent ridership by stop by route by day. The time periods are March 25-April 19, 2019 and March 23-April 17, 2020. Data are aggregated from valid data samples then adjusted by scheduled trips to correct for sampling differences. Ridership generated from additional service during COVID-19 is not included. Therefore it may undercount ridership on some routes where service was added.
Fall 2019 data were collected from the MBTA data portal.
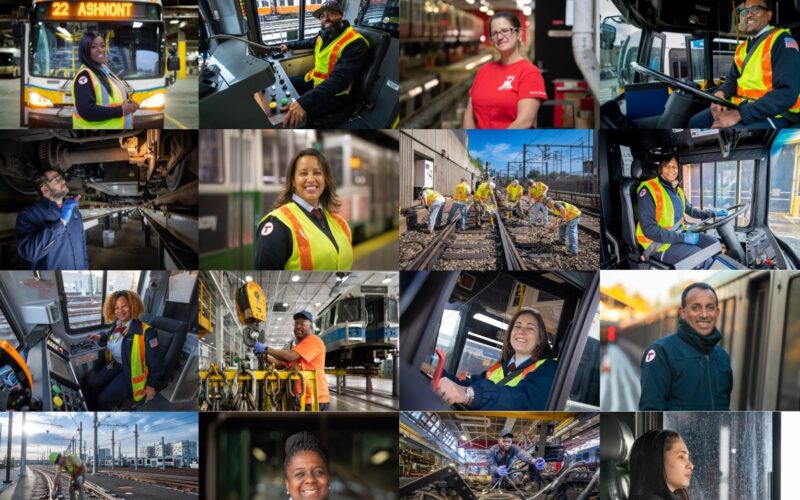 MBTA Partners with Union to Reach Historic Wage Agreement
The Massachusetts Bay Transportation Authority and its union, Carmen’s Local 589, reached a historic agreement to increase bus operators' starting wages from $22.21 to $30 an hour, shifting MBTA operators from the lowest paid to the highest paid in the transportation industry.
Read More New TransitCenter Report: To Solve Workforce Challenges Once and For All, Transit Agencies Must Put People First
TransitCenter’s new report, “People First” examines the current challenges facing public sector human resources that limit hiring and retention, and outlines potential solutions to rethink this critical agency function.
Read More