This guest post comes to us from Ian Thistle and Alissa Zimmer, researchers at the Massachusetts Bay Transit Authority in the Office of Performance Management and Innovation. It’s based on their recent report, “Location, Location, Location: A Neighborhood-Level Analysis of Changes in MBTA Bus Ridership,” which can be downloaded here. Check out other OPMI work at the MBTA’s Data Blog.
This post is part of TransitCenter’s ongoing series about the factors affecting transit ridership in the U.S.
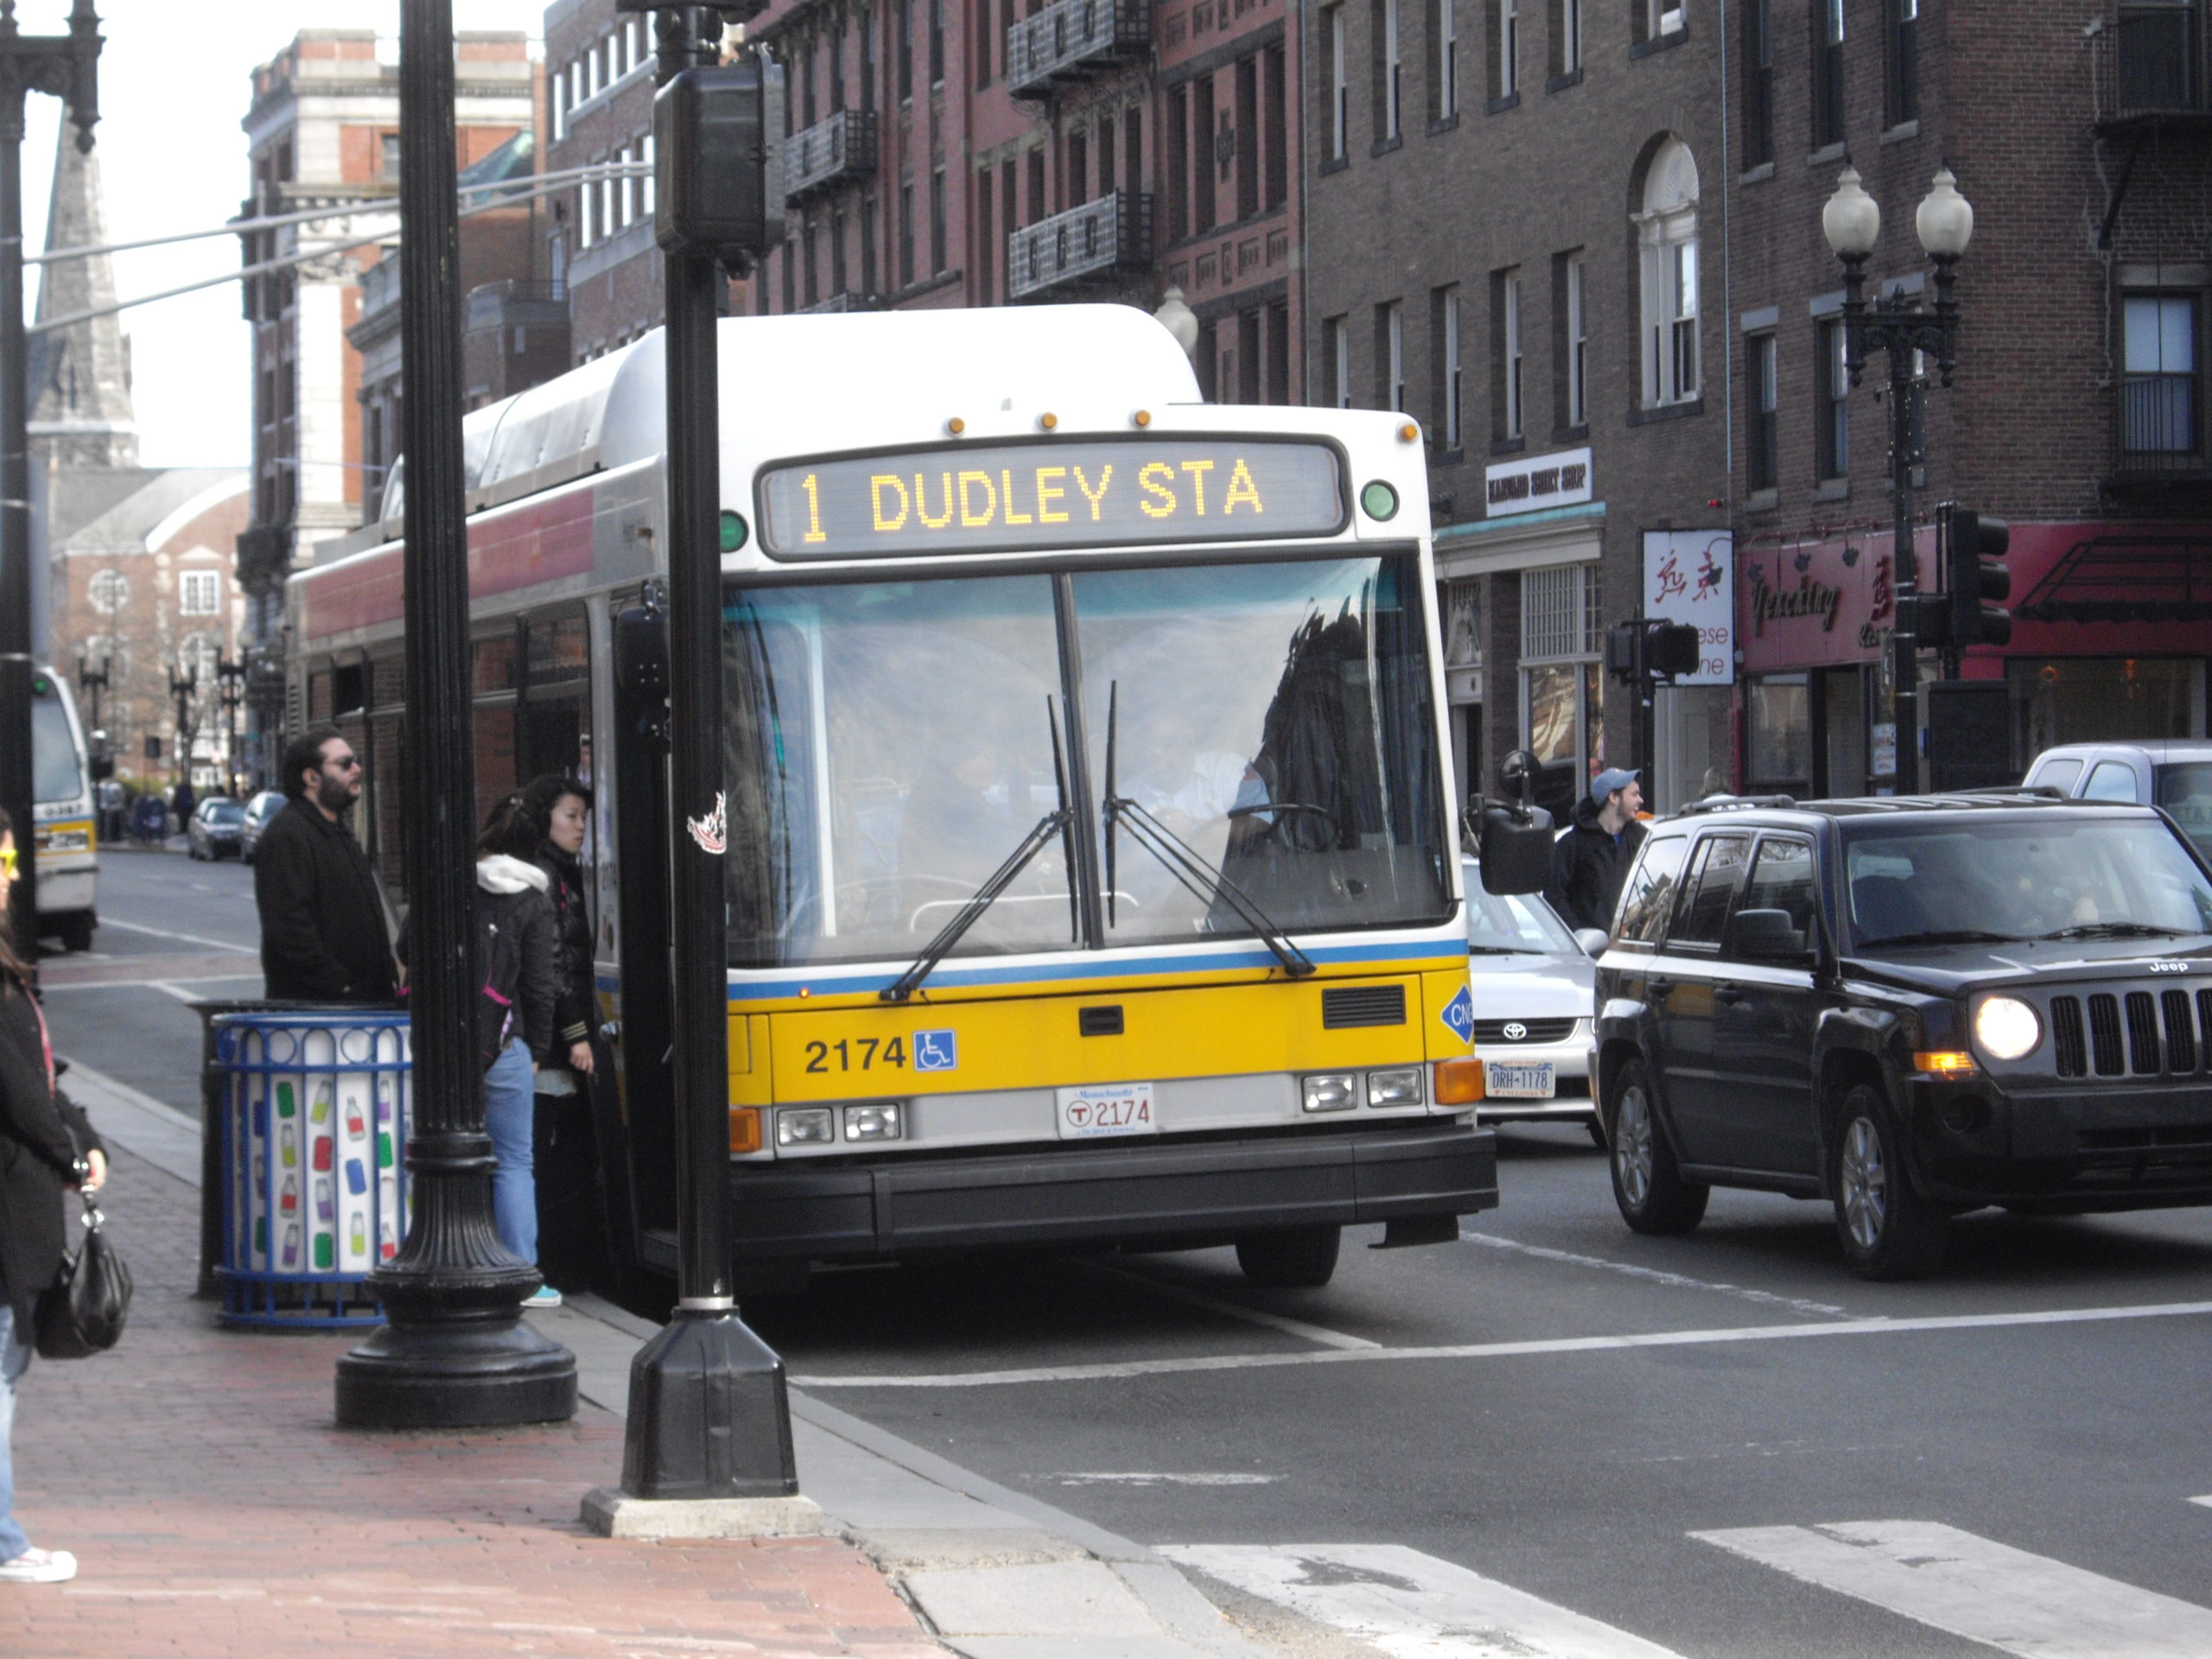
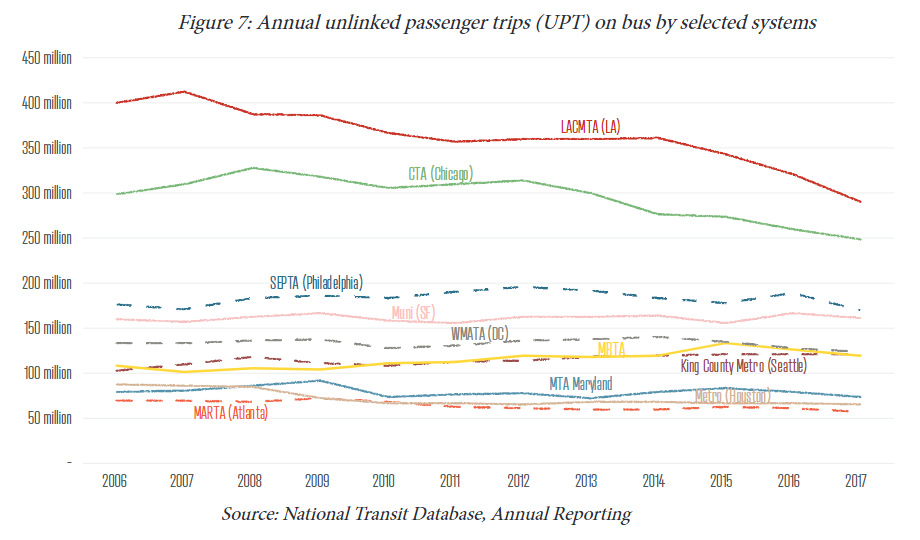
Boston is booming – but ridership on the MBTA’s buses is not. The transit agency’s bus and subway ridership has declined over the past five years, especially on bus routes and during off-peak times. Even during peak hours, ridership is growing less than expected given regional economic growth.
These trends are commonly attributed to services like Uber and Lyft cutting into transit’s market share, as well as increased congestion slowing down buses. But it’s not that simple.
The level and rate of ridership decline is not distributed evenly across the MBTA’s service area. Ridership has grown over the past five years on the Blue Line (which connects downtown to East Boston and communities to the northeast), much of the commuter rail system, and on certain bus routes (particularly in the northeast of the MBTA service area).
These spatial patterns indicate that in different parts of the system, ridership changes in distinct ways. To find out why and to craft appropriate solutions, we conducted a longitudinal regression (typically used to examine regional transit ridership and compare it to other regions), and developed a neighborhood-level analysis to examine how spatial, service, and demographic factors within our region affect ridership more locally.
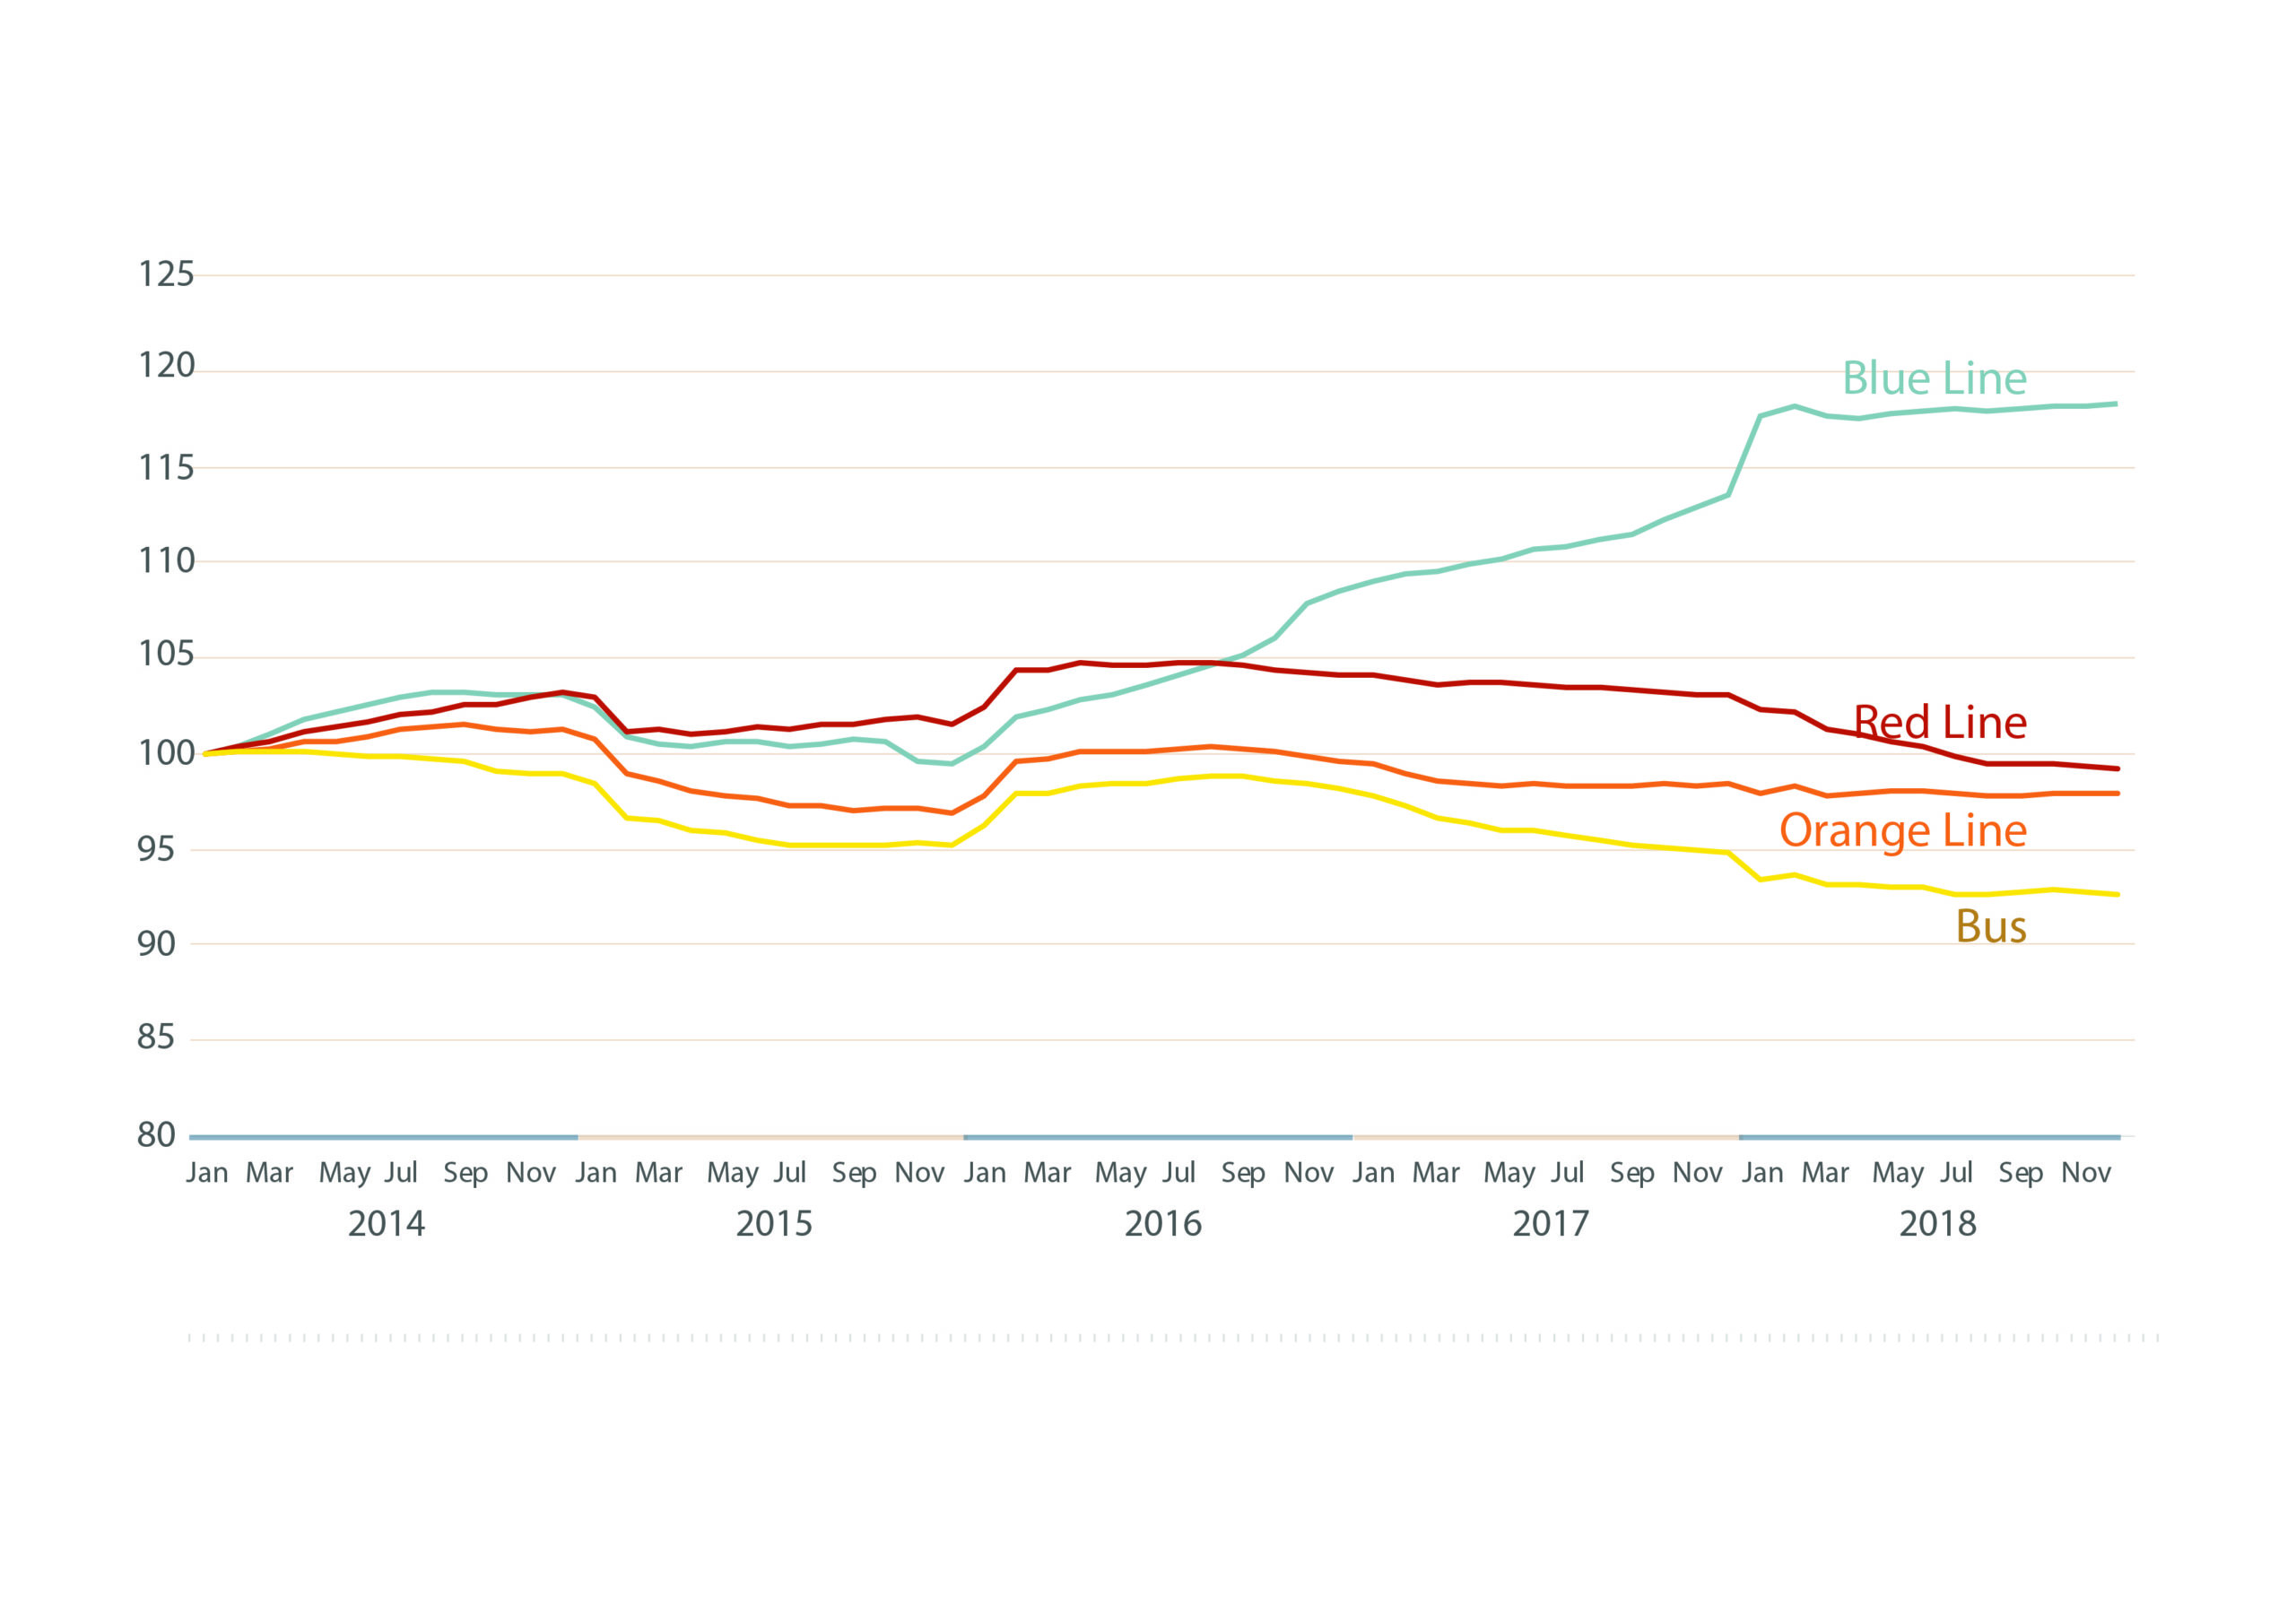
Average peak weekday fare interactions by MBTA line indexed to January 2014
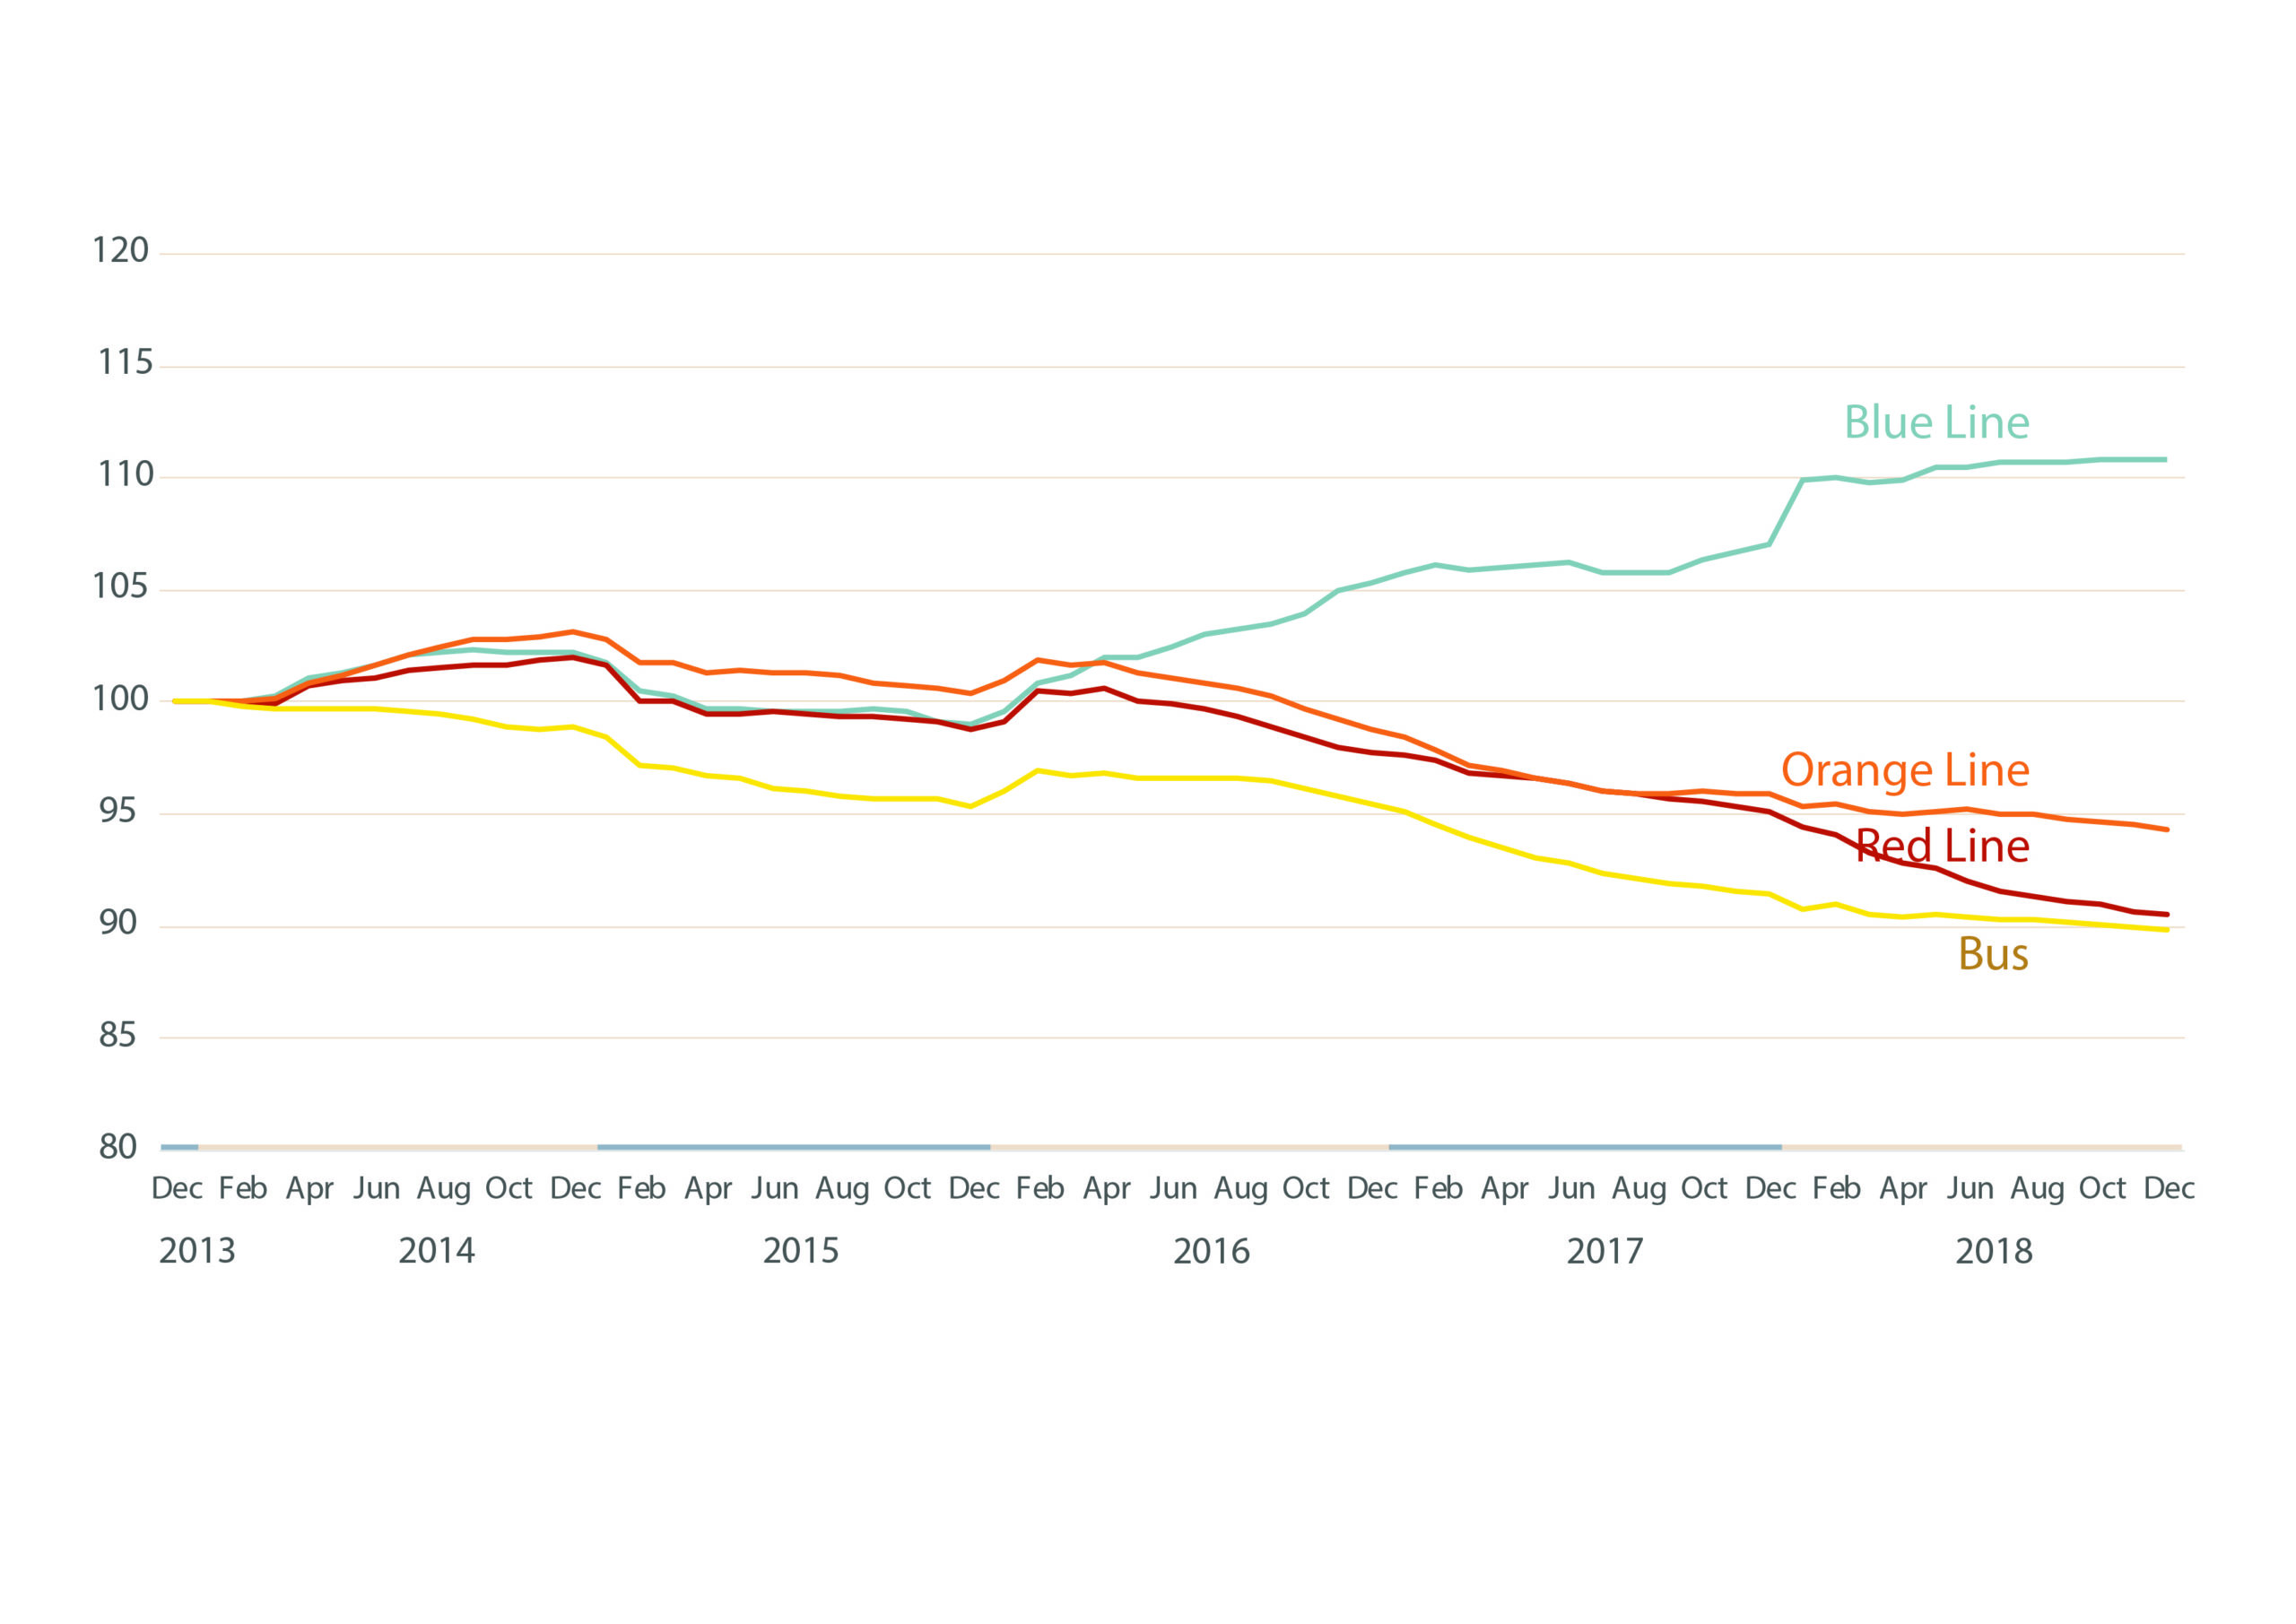
Average off-peak weekday fare interactions by MBTA line indexed to January 2014
Spatial Regression Analysis
We used a geographically weighted regression (GWR), which created local linear regressions for each census tract in our dataset, to examine the relationship between ridership change and local factors at the neighborhood level.
To build our model, we first transformed our ridership data (collected from automated passenger counters on MBTA buses), from the route level to the Census-tract level using a custom method. Then, we tested each potentially-relevant variable for which we had reliable data. These included demographic variables from the Census, (e.g. share of households with vehicles), service characteristics (e.g. scheduled frequency), and performance (e.g. bus speeds). The GWR method also allowed us to factor in each tracts’ relationship to its neighbors.
Our model found that several variables significantly affected ridership. An index of socioeconomic status of the Census tract – based on income, housing costs, education, and more – showed that as these factors increased, ridership decreased. In addition, the speed, frequency, and reliability of buses were positively related to ridership. And as the rate of transfer on routes (the proportion of passengers’ travel on the route that involved transferring to another service) decreased, ridership increased.
We also found that the model’s strength differed throughout the Boston region, suggesting that the variables we tested were more important in certain parts of the system. Particularly, we noticed that the model was better at predicting transit ridership in the southern part of the region than in the northeast. From the south, it is easier and cheaper to drive or bike into downtown than from the northeast, where the limited number of tunnels and bridges are tolled and bike routes are extremely circuitous. Our results suggest that residents of the south are more likely to adjust their ridership in response to changes in transit service or their personal circumstances – because they have better non-transit options for traveling – than northeast residents, who are more reliant on transit.
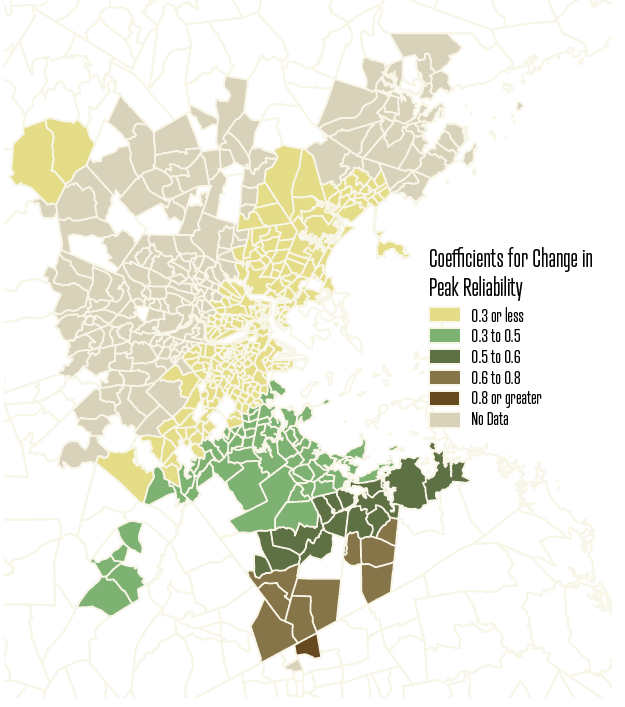
This map shows the relationship between the change in peak reliability and the change in peak bus ridership during the study’s time period. Reliability has a stronger relationship to ridership in the southern portion of our service area, where the options for travel to downtown other than transit are more plentiful and the highways are not tolled.
Conclusions
The regression results reinforced what other studies have found about ridership change and offered quantitative support for theories about MBTA ridership.
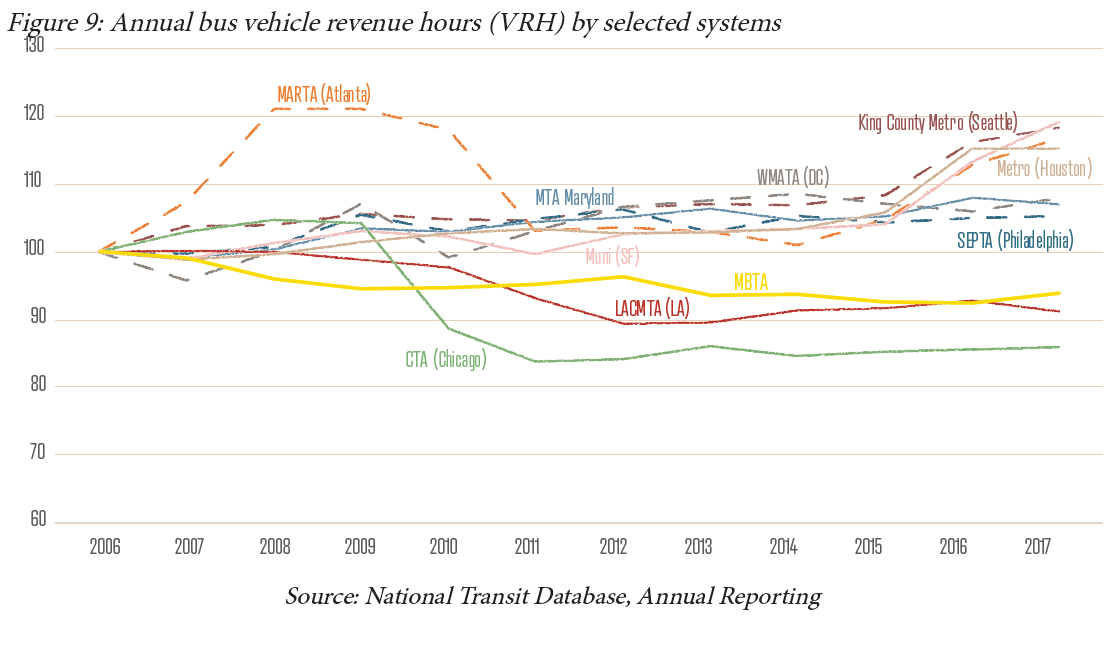
Quantity of service and quality of service matter. In our longitudinal study, we found that many agencies throughout the country with ridership gains (or minimal loss) have increased service, while many of the agencies with the biggest losses have also cut service levels in the last 10 or so years. Our geographically-weighted analysis found that quantity of service and bus speeds are significant predictors of bus ridership locally. And another study by our team found that along a corridor where the City of Boston and MBTA partnered to create a bus lane that improved reliability and travel times, year-over-year ridership increased by roughly 4%.
Among riders, elasticity of demand for transit varies because of physical geography. We began this project after noticing that ridership on bus and subway services east of the harbor was increasing, while ridership on routes in Boston proper was decreasing, even though these areas have similar service characteristics. Our spatial analysis proved that this observation was statistically significant. North of downtown Boston, fewer travel options mean that more demand is funneled onto transit. To the south, there are fewer barriers to take non-transit modes into downtown. Compared to others, riders south of downtown have a more “elastic,” or flexible, demand for transit, and they adjust their ridership more in response to changes in service quality.
For more information, you can our read our full report.
 Built to Win: Riders Alliance Campaign Secures Funding for More Frequent Subway Service
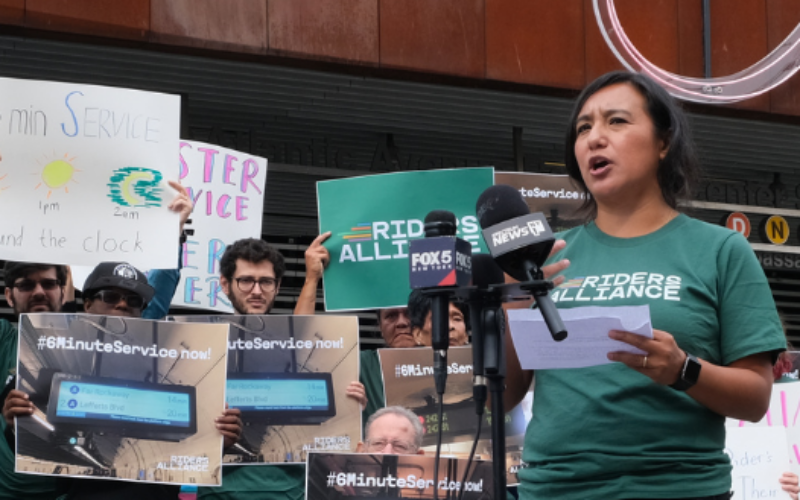
Thanks to Riders' Alliance successful #6MinuteService campaign, New York City subway riders will enjoy more frequent service on nights and weekends, starting this summer. In this post, we chronicle the group's winning strategies and tactics.
Read More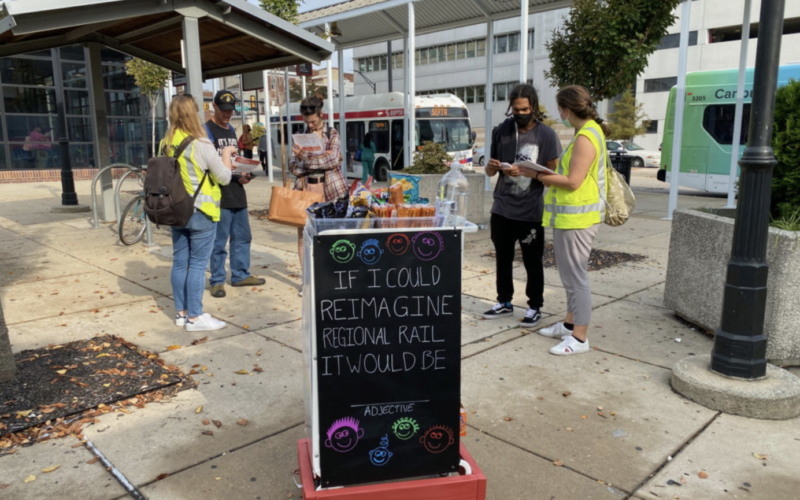 A Transit Revolution in Philadelphia?
The Southeastern Pennsylvania Transportation Authority (SEPTA) has been working throughout the pandemic on several system-wide planning initiatives that have the potential to transform transit service in and around the city of Philadelphia.
Read More