Baltimore's Red Line could be transformational for the city's most vulnerable residents, depending on how much the project runs in its own right-of-way.
This piece was co-authored by TransitCenter, the Central Maryland Transportation Alliance and Willem Klumpenhouwer, a public transit research consultant.
The Red Line is a proposed 14-mile rapid transit line that would run through Baltimore’s east-west corridor. It is the missing link between Black, working-class neighborhoods to the east and west and job-rich areas like Woodlawn, downtown Baltimore, and Bayview, as well as connections to existing rapid transit lines.
The Red Line project – which has been in the works since 2011 – is long overdue. Since the removal of the streetcar network, there has not been a reliable, direct east-west transit connection in Baltimore. But in 2015, then-Governor Larry Hogan dealt the project a devastating blow by halting the planning process and turning away $900 million in promised federal funds. To add insult to injury, he shifted $725 million of state funds to road projects outside of Baltimore.
Under its original timeline, the Red Line was supposed to begin service in 2022. Instead, the plan gathered dust until newly-elected Maryland Governor Wes Moore made building the Red Line a pillar of his transit equity platform. In 2023, he gave the Maryland Department of Transportation (MDOT) the green light to resume the project.
The Red Line’s broad strokes have been determined: its western end will be the CMS Social Security Center in Woodlawn, Baltimore County; it will pass through West Baltimore, stop downtown, head east through Canton, and end at the Johns Hopkins Bayview Medical Center. Along the way, the Red Line will connect to the MARC train (commuter rail) and Metro Subway, Light Rail, and bus service.
Now, MDOT is determining what should be the Red Line’s mode, right-of-way, and alignment. MDOT is deciding between bus rapid transit, also known as BRT, or light rail. Right-of-way refers to whether the line has dedicated space or runs on surface streets, meaning vehicles have to stop at signals and wait for crossing traffic. Its alignment is the pathway the line will follow.
MDOT compared six scenarios to weigh how the characteristics would impact the Red Line’s estimated ridership, population served, speed, and capital costs:
- Option 1 – Light rail – partially-dedicated right-of-way through tunnels – South through Woodlawn / Option 3 – the same as 1, but BRT
- Option 2A – Light rail – runs on streets – North through Canton / Option 4A – the same as 2A, but BRT
- Option 2B – Light rail – runs on streets – South through Canton / Option 4B – the same as 2B, but BRT
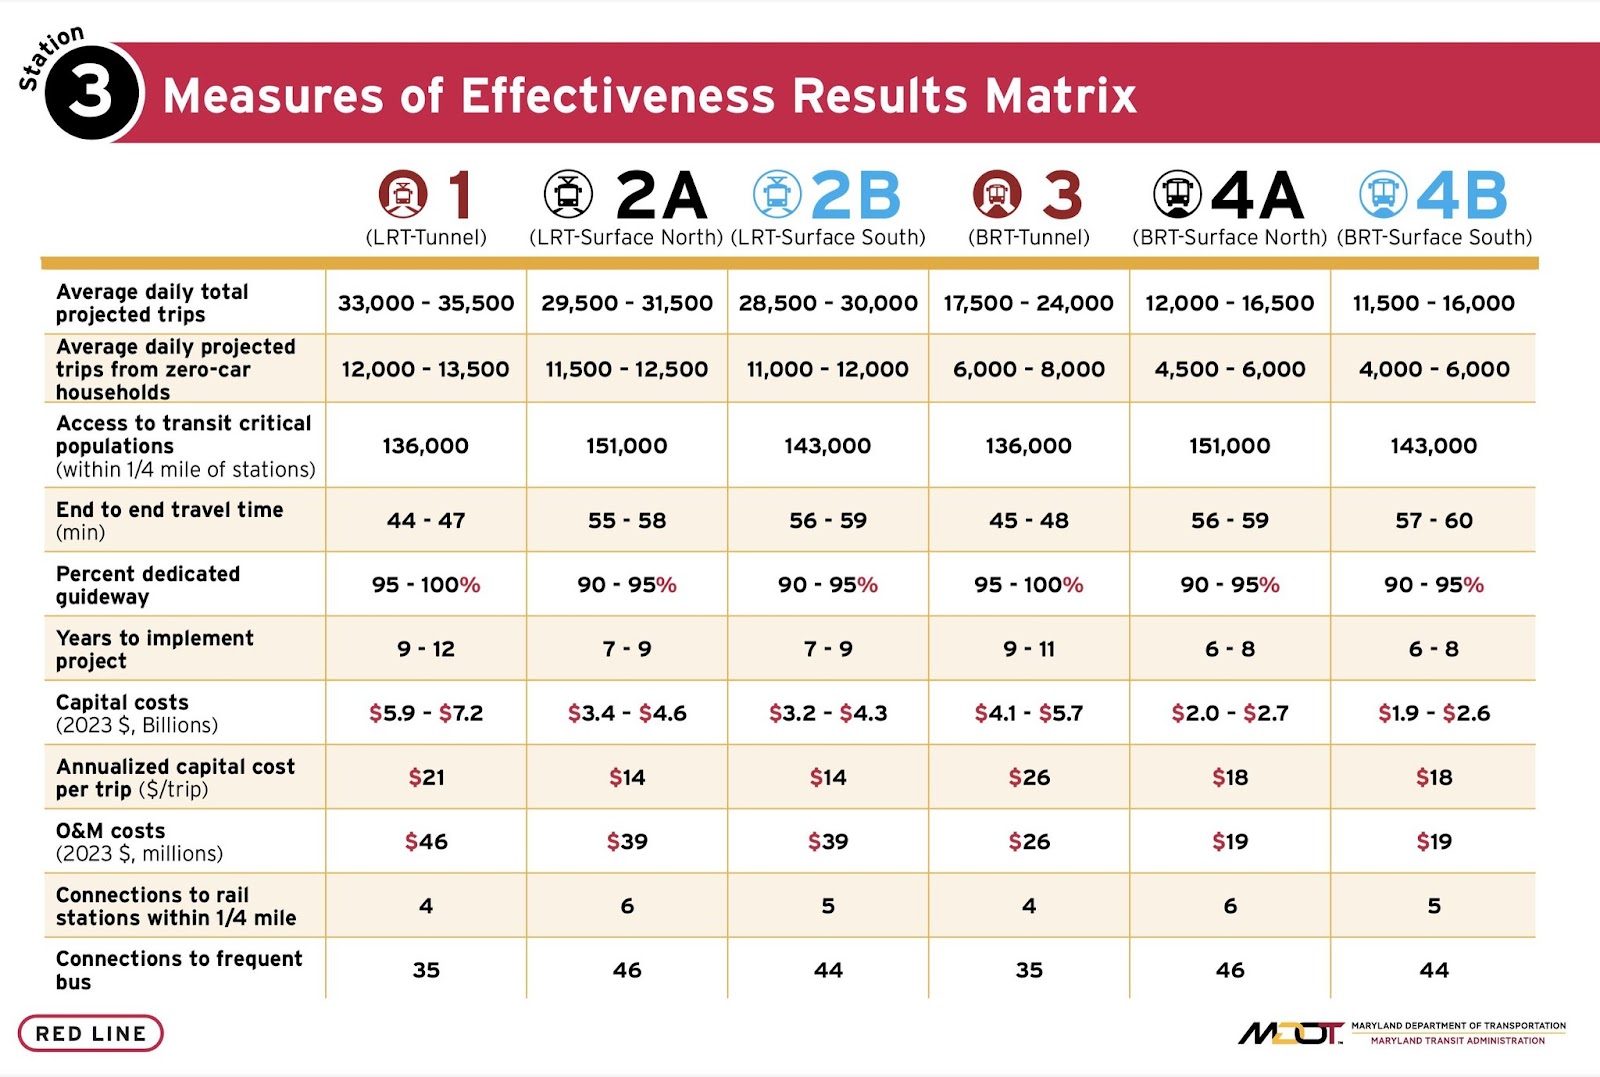
Baltimore’s Red Line scenarios and their effectiveness results matrix. Note no access to opportunities measures are included (MDOT).
Informed by analysis and public input, MDOT will identify its preferred option in early 2024, noting that it may include elements from all six scenarios. Then, it will reapply for federal funding, the next stage in the Red Line finally becoming a reality.
TransitCenter and our research partner Willem Klumpenhouwer conducted an independent scenario comparison of the Red Line to provide additional insight into the potential benefits of the Red Line project and each scenario. To undertake this analysis, we used a brand-new tool developed for TransitCenter which allows us to compare access and equity for different transit scenarios anywhere in the United States. We used this tool to understand the potential impact the Red Line will have on access to opportunity and to compare the scenarios under consideration from an access lens.
We found that the Red Line, whatever final form it takes, will be a great transportation project, providing an easy, affordable way for Baltimoreans to get to work, school, and other destinations, while easing traffic congestion through city neighborhoods and improving air quality. However, our analysis did find significant differences in key access metrics based on how much of the project has its own dedicated right-of-way. We explore those differences below.
That the Red Line project languished for so long adds urgency to the need to invest fully in the project to make it a successful, useful, and equitable service for Baltimoreans for generations to come. Maryland’s Governor Wes Moore must identify the necessary funding to move this project forward.
Access measures are missing from MDOT’s key measures of effectiveness
MDOT’s evaluation of the Red Line scenarios focused on concepts such as travel time savings, ridership, and cost-effectiveness. While important, these metrics don’t fully capture the Red Line’s usefulness to riders or its contributions to transit equity. To bridge this information gap, our analysis centers on access to opportunity by public transit.
Access to opportunity measures how easily people can reach the places they need to go on public transit. It layers the transit network (where, when, and how often transit lines stop, and how fast transit routes are) on top of land use (where destinations are) to determine how many, or how quickly, transit riders can connect to key destinations. Ultimately, access to opportunity describes the benefit people get from public transit.
Access to opportunity can be calculated at a hyper-local scale, making it possible to understand transit service equity — if underserved population groups or neighborhoods benefit the most from a public transit project or service.
How, where, and when we measured access
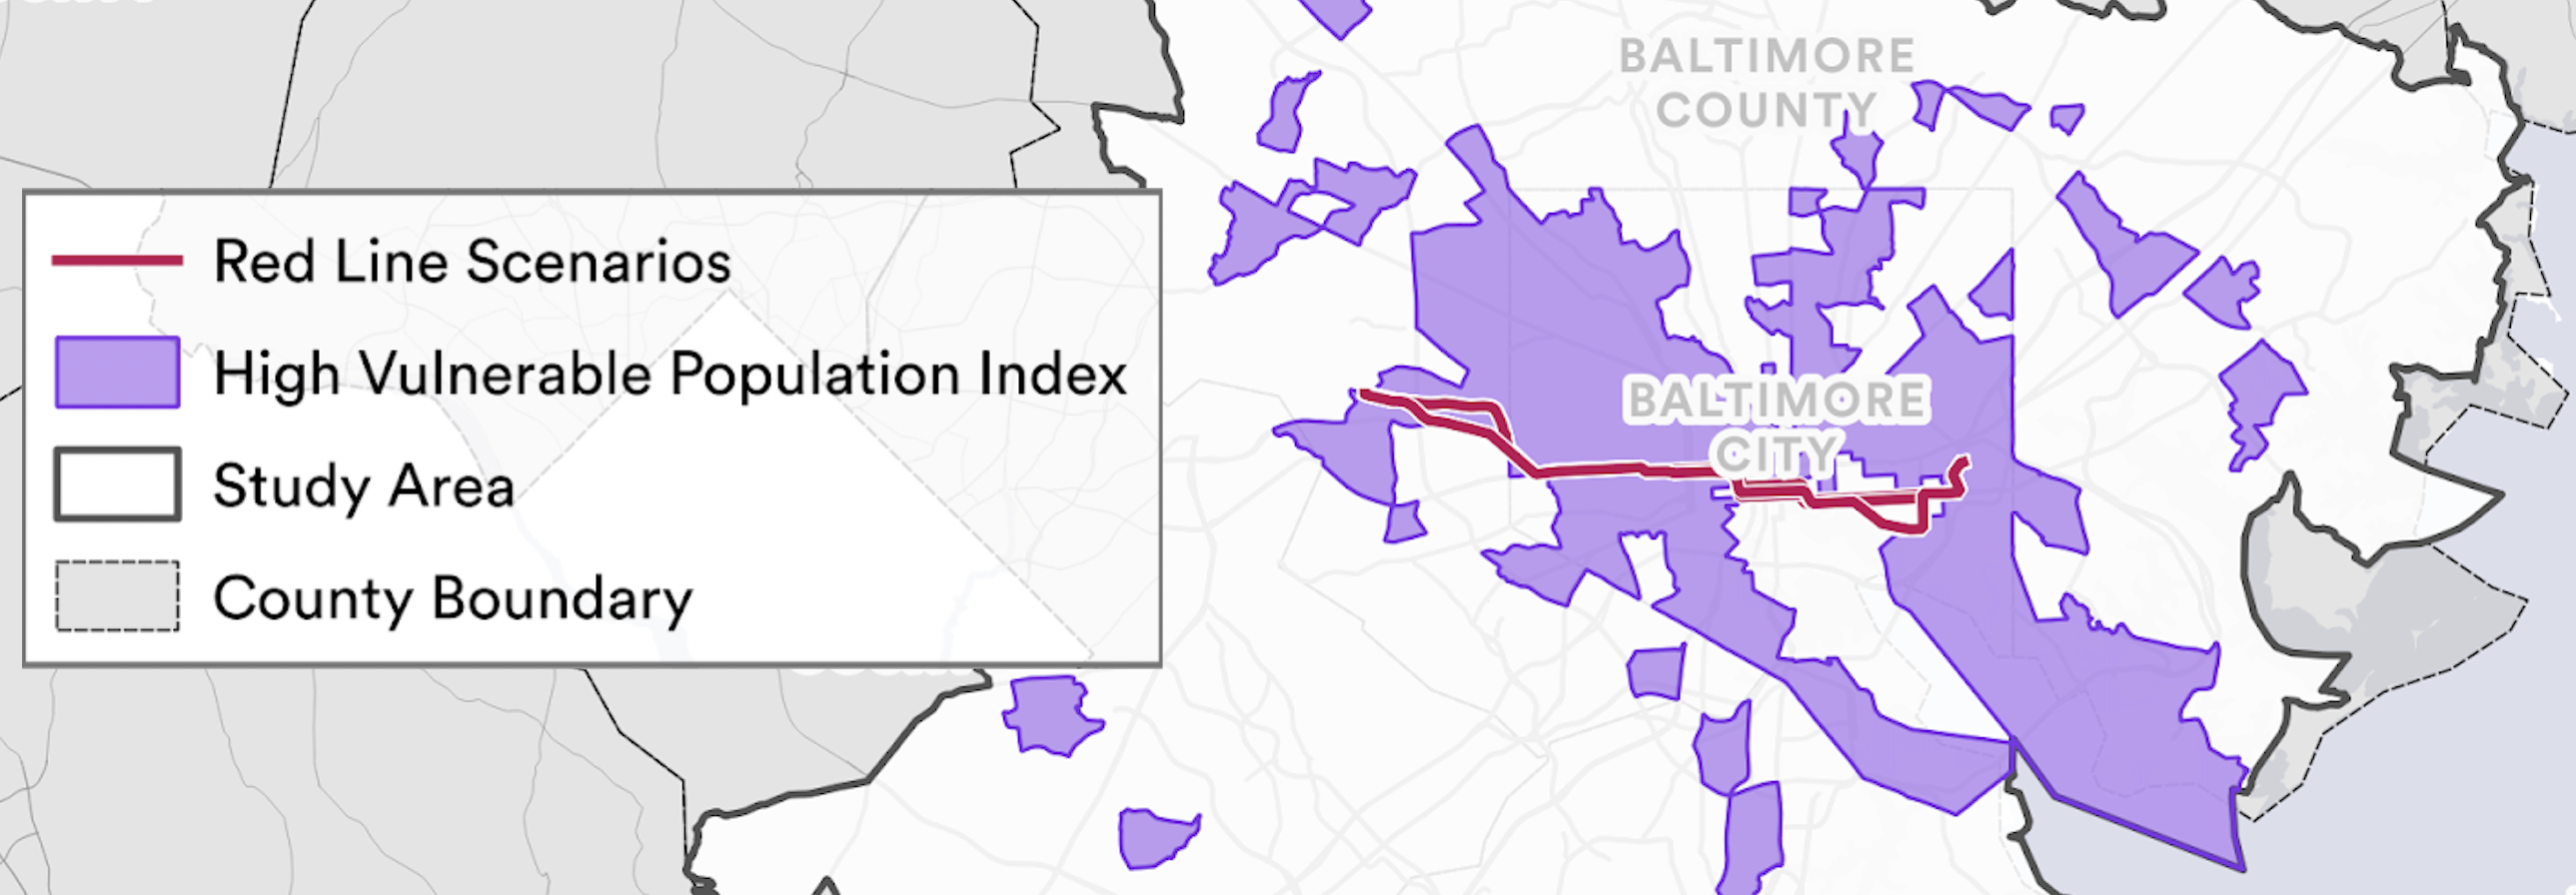
We studied how the Red Line will increase access to jobs located throughout the Baltimore urbanized area (shown as the “study area” below). We calculated outcomes for residents of areas with higher levels of vulnerable populations (shown in purple below, also referred to as vulnerable population areas) to understand how members of historically marginalized groups in particular would benefit from the Red Line.
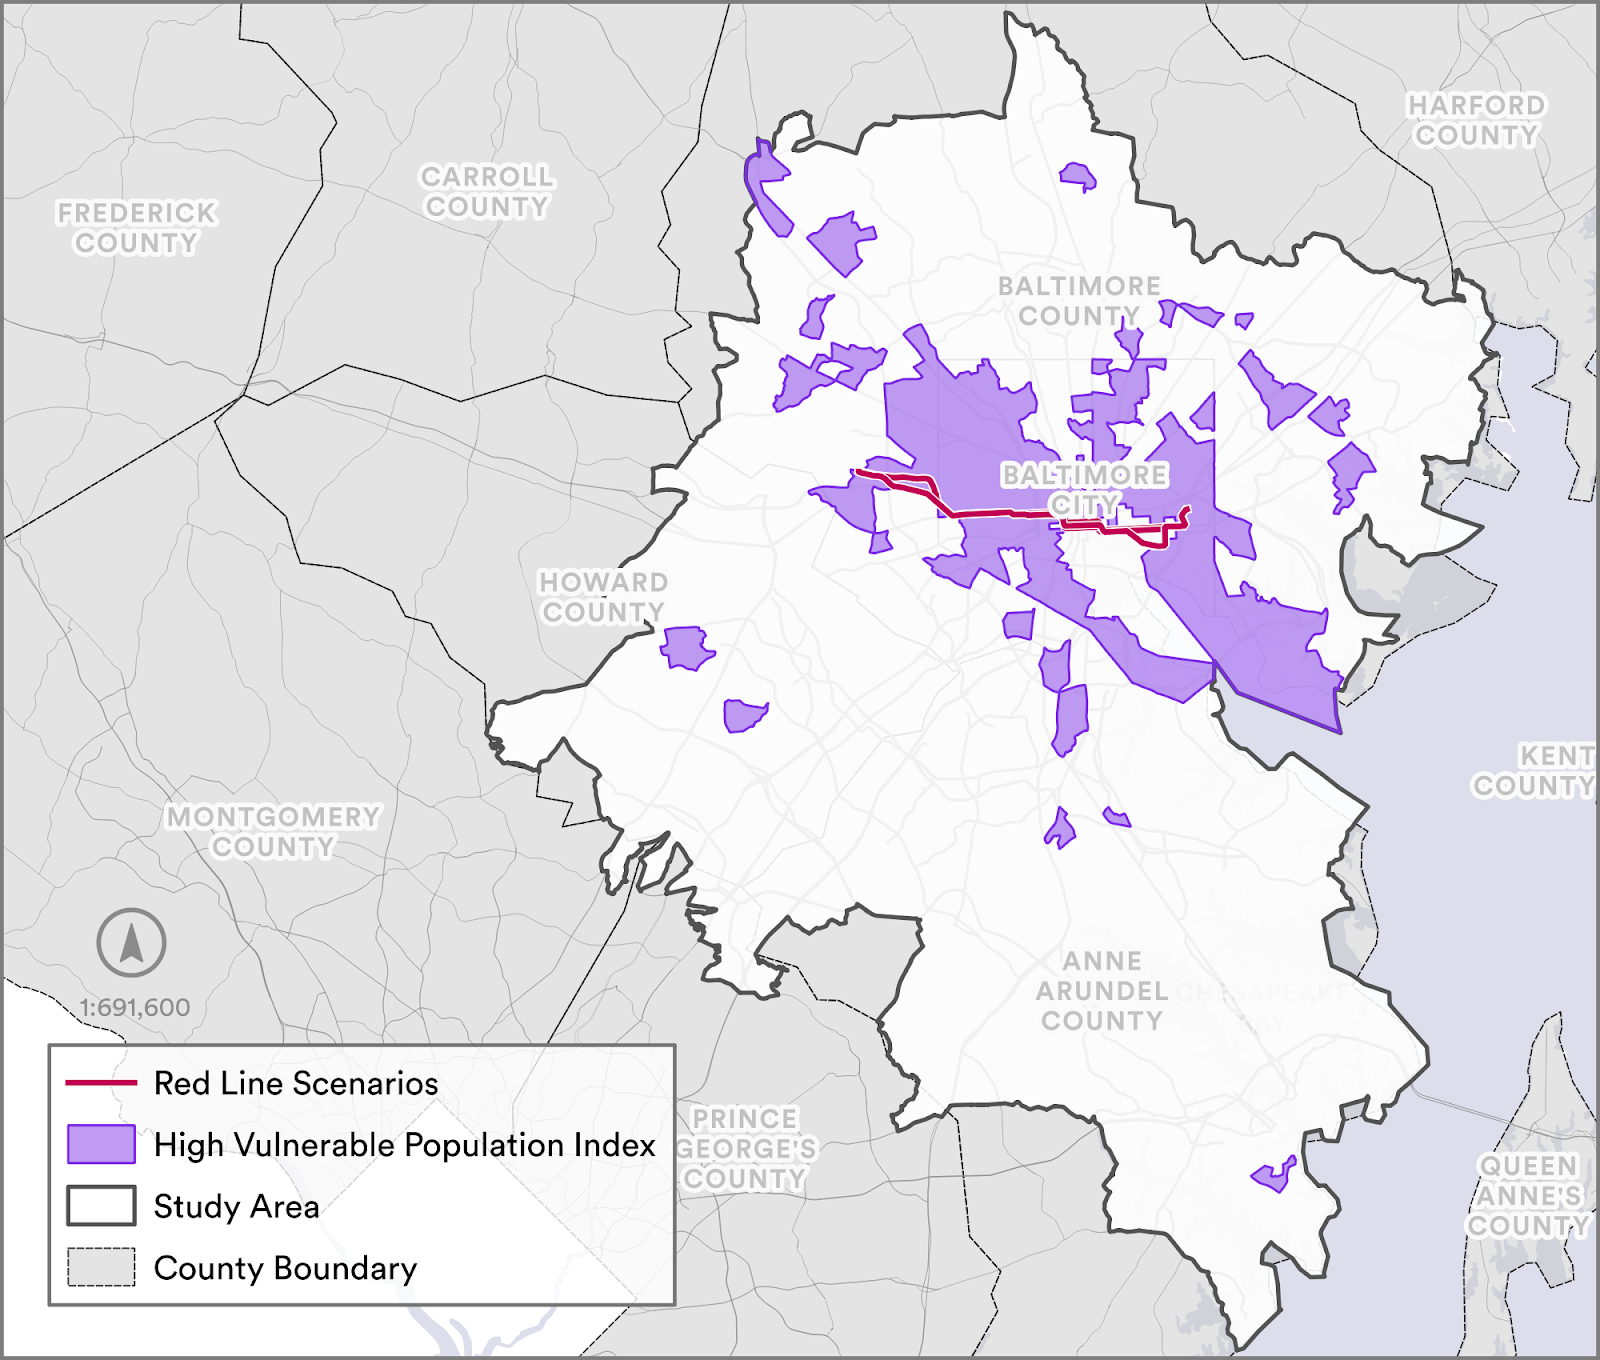
Baltimore region, with the study area outlined in white, and areas of high vulnerable population indices marked in purple.
We focus on access to jobs as a proxy for broader economic opportunity. In particular, we measured how many jobs can be reached from a given area in 60 minutes of transit travel time, before and after the implementation of the Red Line scenarios. As the speed, frequency, and connectivity of a transit system goes up, this will increase the number of reachable jobs in that 60 minutes. We measured this value for a typical Wednesday morning commute, between 7 and 9am.
We assumed that the new Red Line service would run with 10 minute headways during the AM morning peak. We used 10-minute headways for all scenarios.
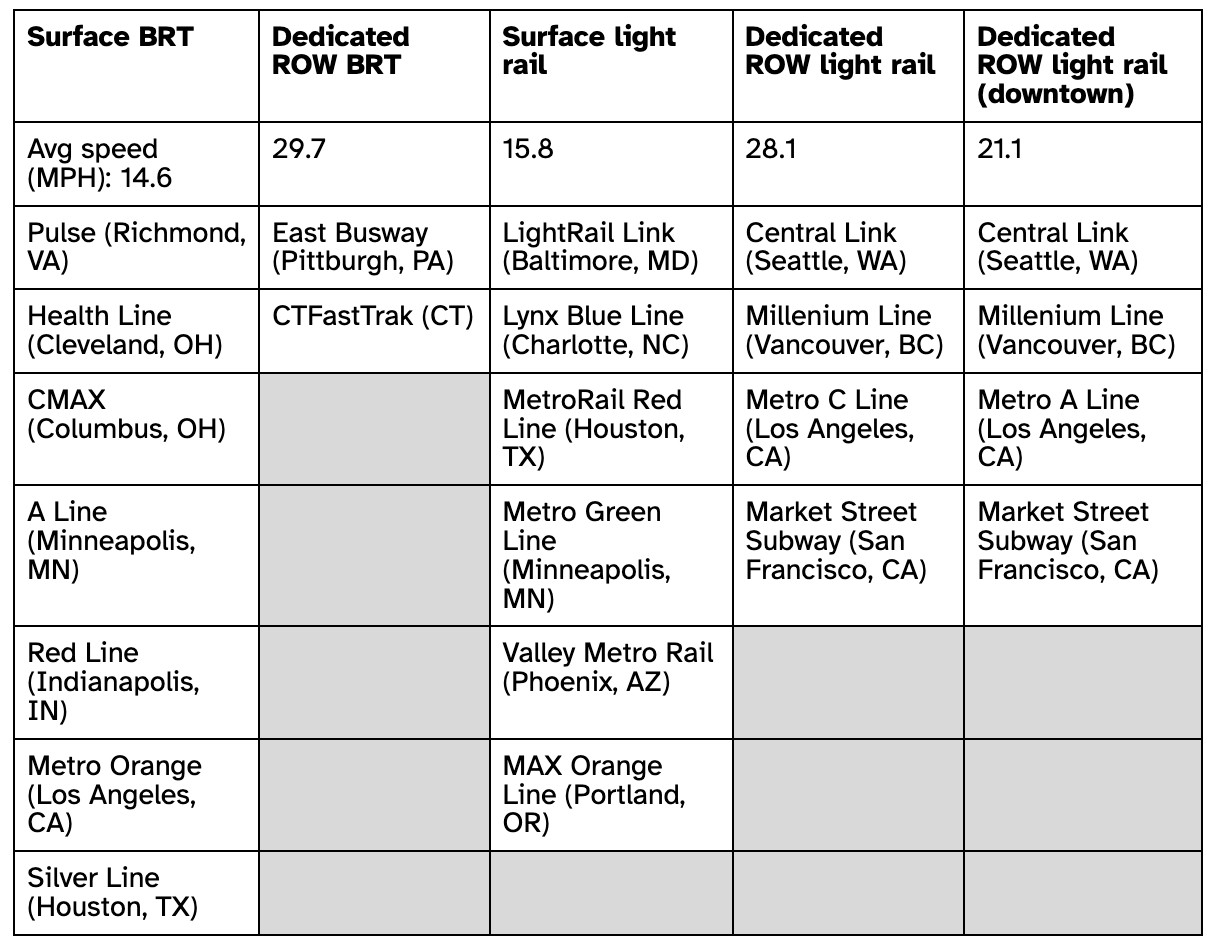
To determine plausible run times for each scenario, we analyzed existing, comparable BRT and light rail projects across the country. We found that the extent of dedicated right-of-way had the most impact on the speed of service, while the mode made little impact on speed. In other words, speed is a function of having a dedicated right of way, not of being BRT or light rail. As such, we narrowed our analysis to the three light rail options proposed by MDOT, labeled Option 1, 2A, and 2B in the chart above. We did not analyze their BRT counterparts, which had similar speeds and therefore would have had similar impacts on accessibility.
| Surface BRT | Dedicated ROW BRT | Surface light rail | Dedicated ROW light rail | |
| Avg speed (MPH) | 14.6 | 29.7 | 15.8 | 28.1 |
Avg speeds including dwell time for existing rapid transit projects
To drive home the benefits of higher speed, we also proposed our own scenario which we are calling Scenario 1S: A fully-tunneled version of the partially-tunneled Scenario 1. Scenario 1S runs at speeds to be expected from a fully-separated, exclusive transit service (e.g. a subway or elevated guideway).
Faster service options greatly improve access for Baltimoreans
Let’s begin with maps: Each of the four maps below show the area around the Red Line project, colored by the number of additional jobs reachable by public transit, compared with not building the Red Line at all. The legend in each map is the same, so you can compare the maps directly.
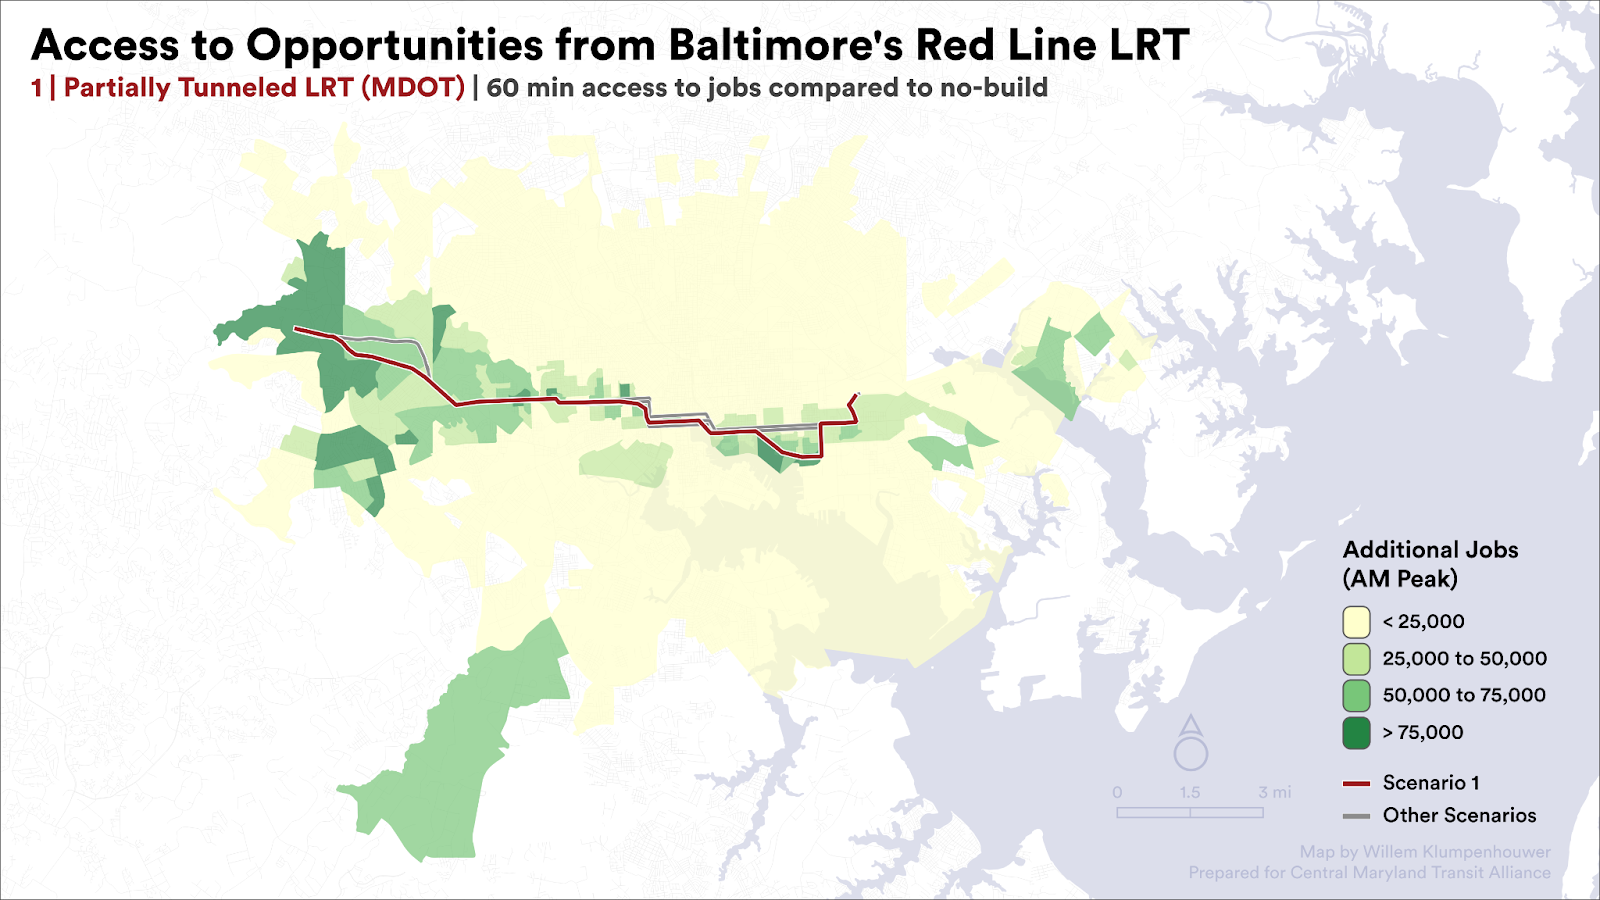
Additional jobs reachable in 60 minutes resulting from Red Line Option 1.
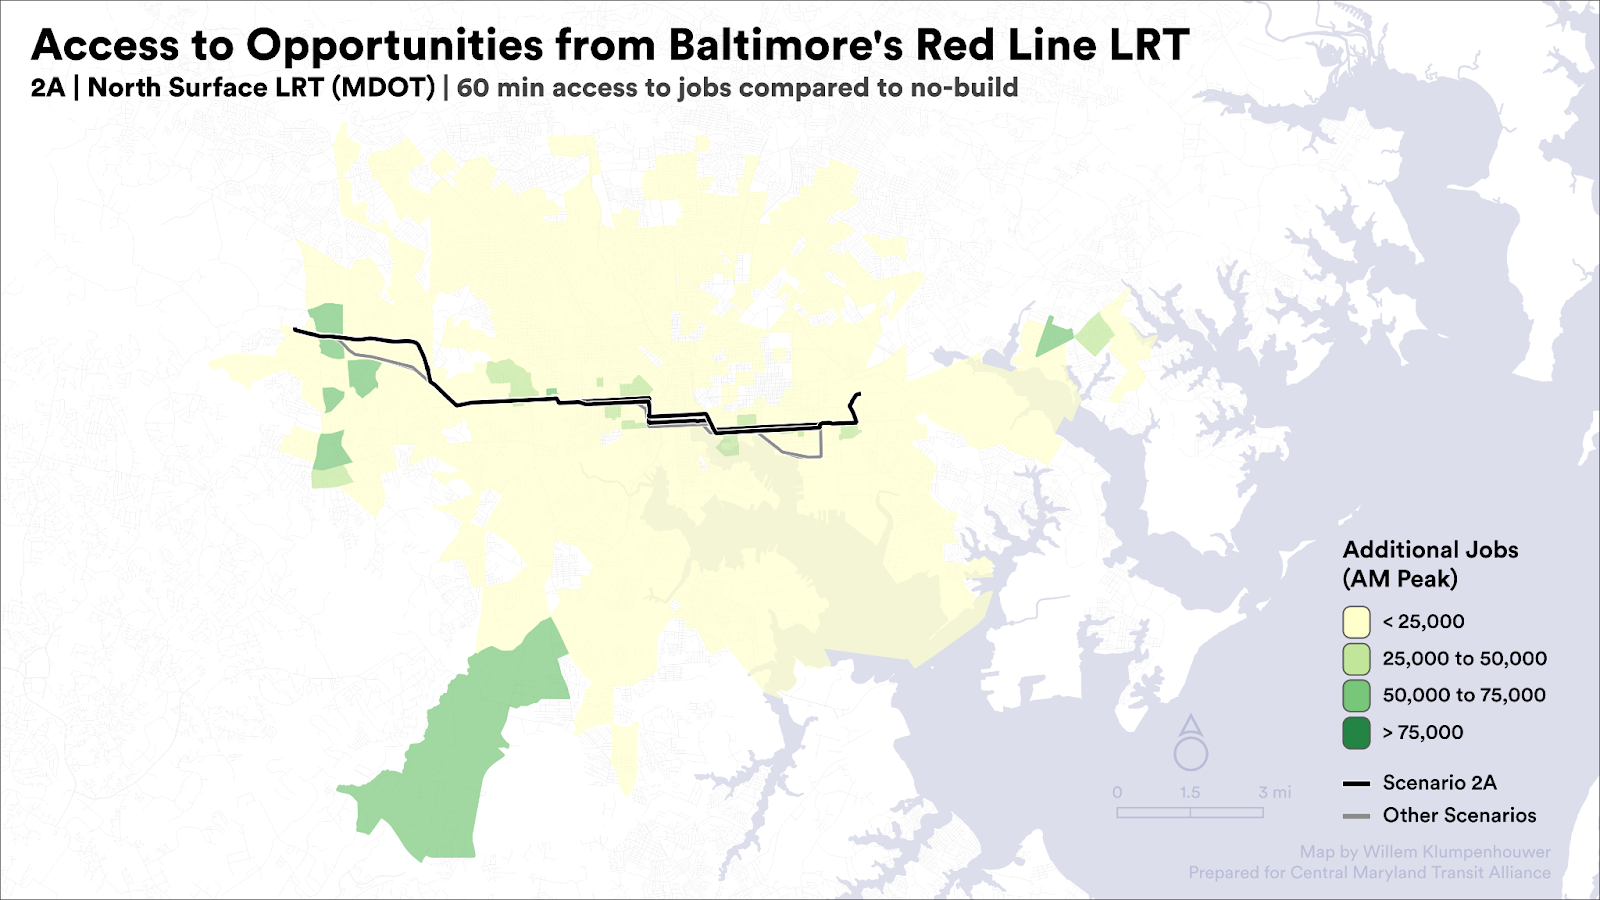 Additional jobs reachable in 60 minutes resulting from Red Line Option 2A.
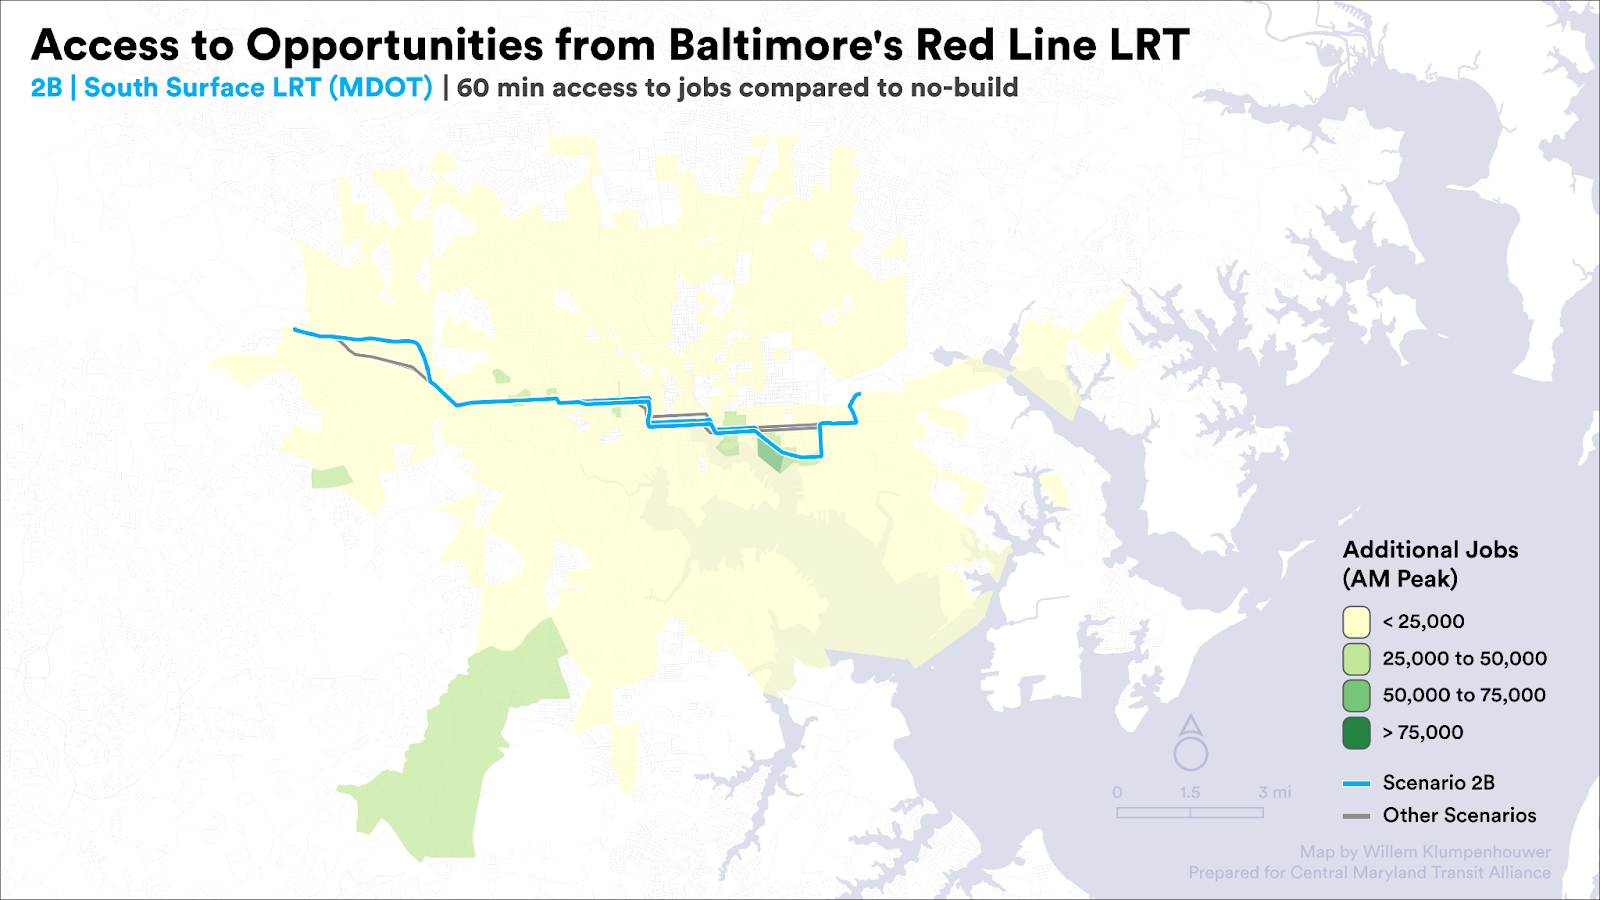
Additional jobs reachable in 60 minutes resulting from Red Line Option 2B
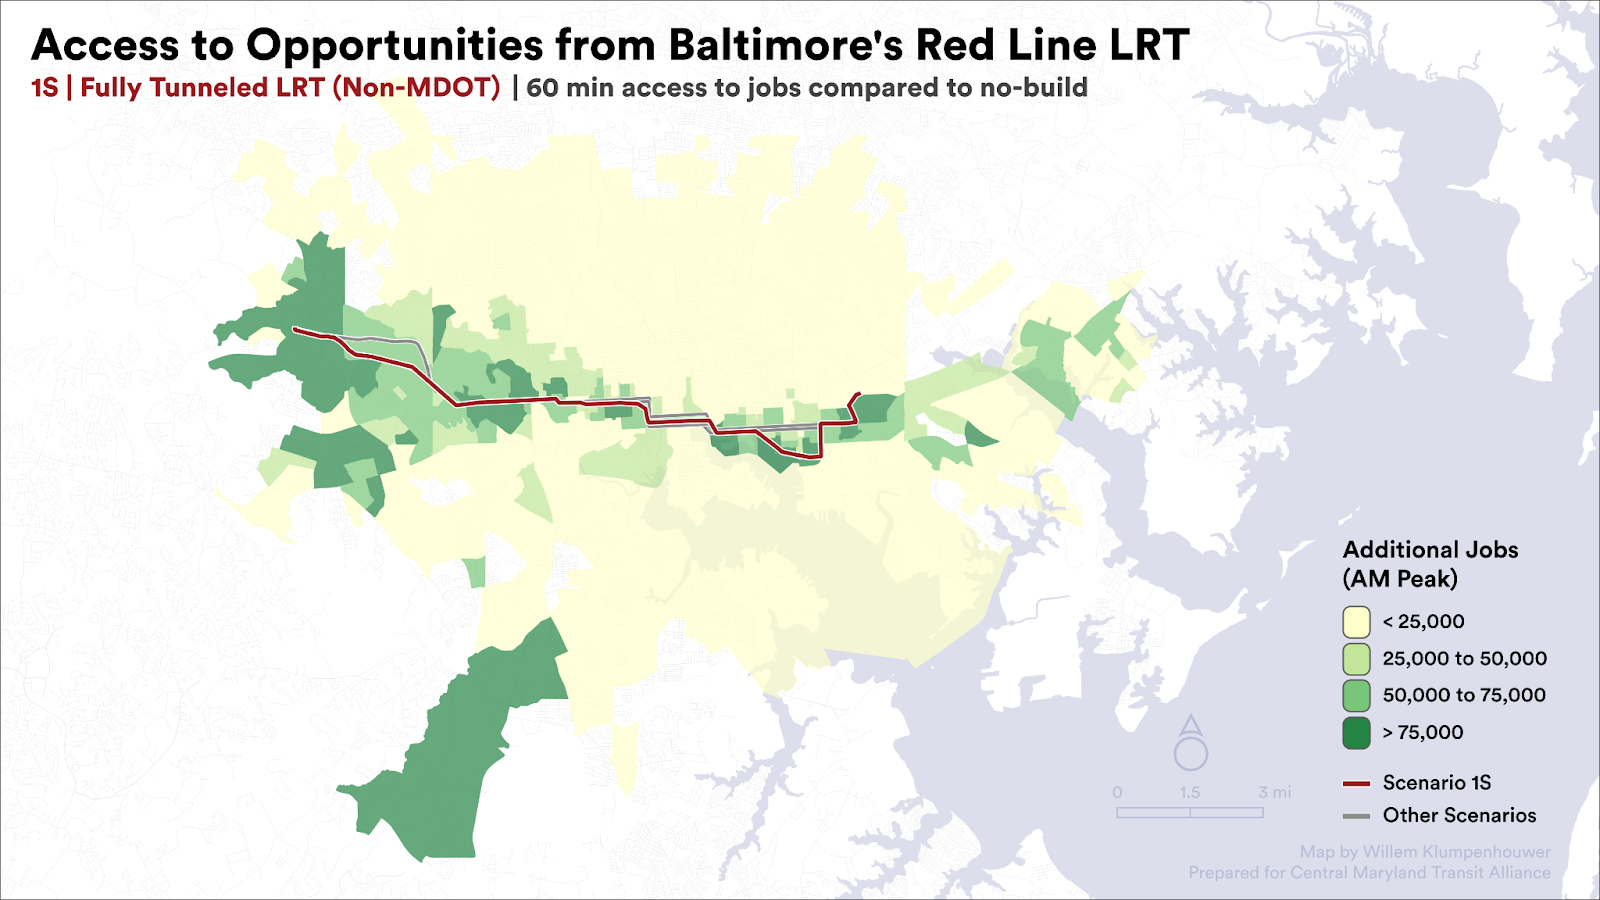 Additional jobs reachable in 60 minutes resulting from a fully grade-separated option proposed by us (Option 1S)
These maps show us a few key insights about how the line will serve different parts of the region:
- Option 1 and our aspirational Option 1S provide significant access to jobs benefits over Options 2A and 2B. This is especially true in the west of Baltimore City and into western Baltimore County. There are fewer jobs located in these neighborhoods, so residents benefit a lot from having a fast transit connection to the region’s job centers.
- There are some improvements (indicated by the pale yellow) in quite a large area covering most of Baltimore City, parts of Baltimore County, and the northern tip of Anne Arundel County. This means that the Red Line will provide more access for riders across the region, even if they don’t live directly on the new line.
- The differences in the alignments are minimal compared to the overall impact of having the line itself, especially on the outer ends of the line.
We also calculated the average increase in access to jobs for everyone living in Baltimore’s vulnerable population areas.
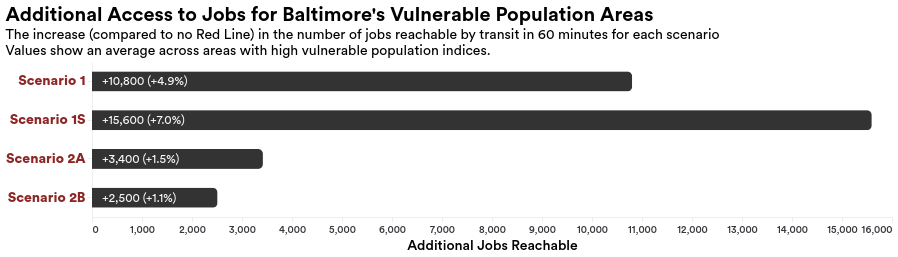
We found that Options 1 and 1S provide substantially more access than Options 2A and 2B. For reference, vulnerable area residents on average have access to 229,000 jobs riding the existing transit system with no Red Line. If Red Line 1S were built, they would be able to reach an additional 15,600 jobs in 60 minutes.
A 5-7% increase in access to jobs is substantial for a single transit project, a fact that underlines the great need for rapid transit in the Red Line corridor. A study of Toronto’s Ontario Line project with an estimated price tag of $12-$14 billion found it would increase access by around 3%. The average resident of low-opportunity neighborhoods in Baltimore lost access to 3% of jobs in 45 minutes following BaltimoreLink, the bus network redesign, according to a study titled Are We Better Off? by the Central Maryland Transportation Alliance.
The Red Line improves access for a range of marginalized population groups
In addition to the overall benefit, we wanted to know how exactly the Red Line will impact marginalized communities in the city. To do this, we not only considered where the additional benefits of access are located, but who lives in this area.
Here’s a map that shows an example of how populations and benefits intersect. On this map, higher values of access are shown in brighter blues, while a higher index of vulnerability is shown in brighter oranges. When you combine the two, areas with both high improvements in access and high vulnerability indices show in darker greens.
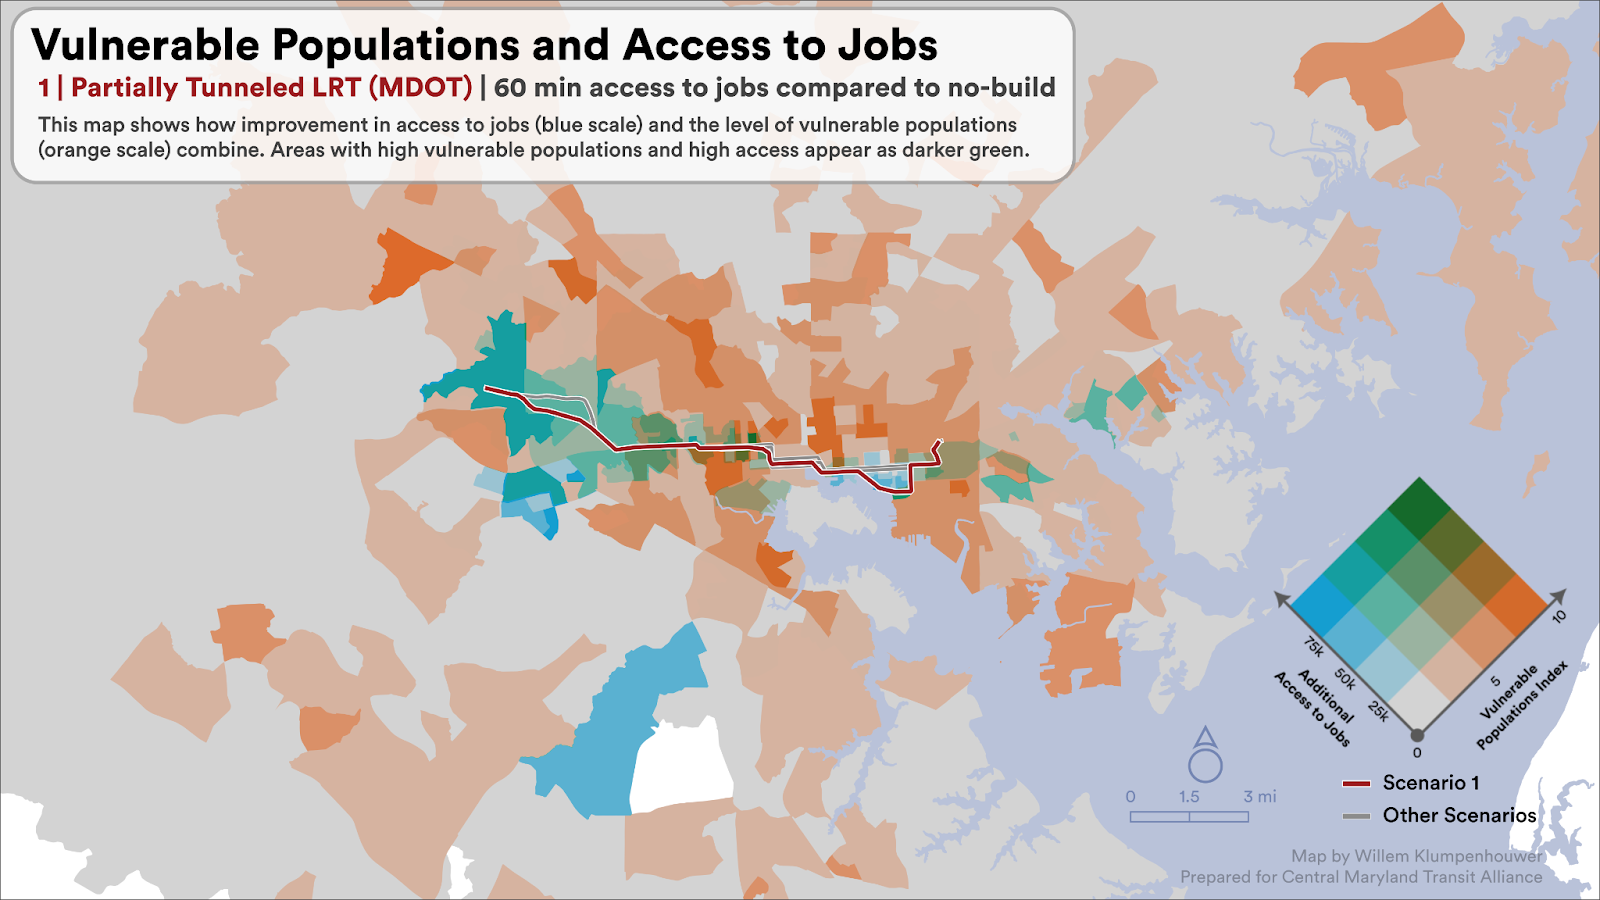 Baltimore’s Red Line Option 1, benefits, and vulnerable populations nearby.
Just as we considered the average improvement for everyone in the chart above, we can do the same thing for different population groups. The chart below shows the breakdown of improvements across scenarios and population groups.
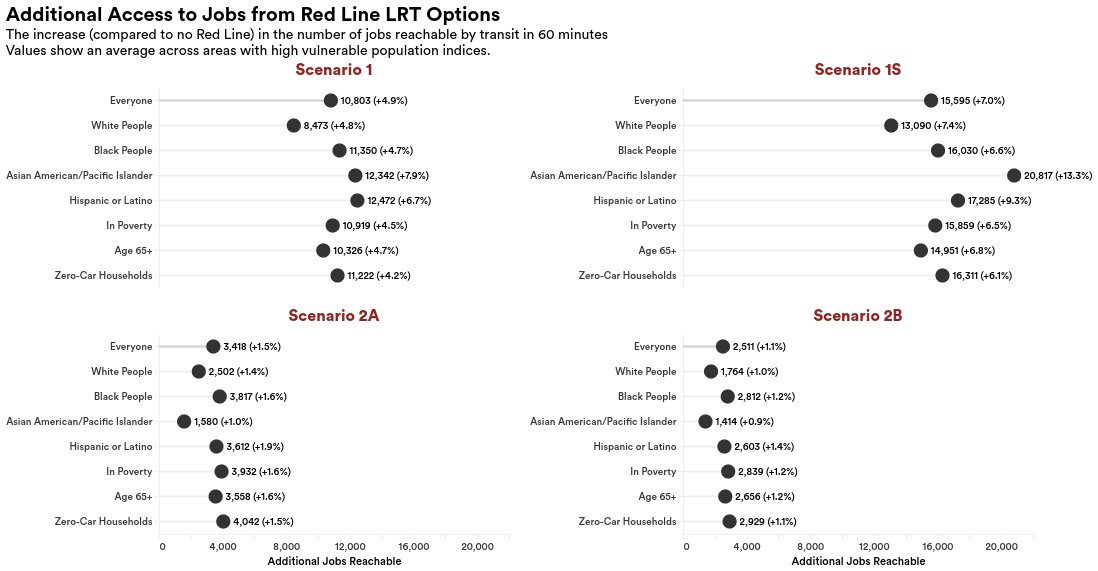
With a few exceptions in Options 2A and 2B, marginalized populations benefit as much or more than average. Overall, though, we can see that Options 1 and 2 provide a greater level of increased benefits for people of color and to those who do not own a car.
What did we learn about the Red Line?
- Our analysis confirms that the Red Line would dramatically increase access to opportunity by transit in Baltimore. This finding is robust; in every Red Line scenario, we found that Baltimore transit riders would be able to reach tens of thousands of more jobs within an hour. And the Red Line’s benefits would extend to those who don’t live near its proposed route. Residents in most of Baltimore City, parts of Baltimore County, and the northern tip of Anne Arundel County would benefit from higher job access because they can transfer to the Red Line on their way into the downtown.
- Because Baltimore transit riders are predominantly low-income people of color, any improvements to the transit system have positive effects on equity in the region. The Red Line, in particular, will improve transit equity by bequeathing people of color and low-income people with the greatest gains in access to jobs. West Baltimore neighborhoods would have the biggest increases in access to jobs from the construction of the Red Line.
- We conclude that dedicated right-of-way makes the biggest difference in the Red Line’s potential to increase access for Baltimoreans. Right-of-way determines the speed at which service runs; speed determines how far people can travel in a given time, and therefore what destinations they can access. Options 2A and 2B share surface-level streets (no dedicated right-of-way) and run 55 minutes end-to-end. Option 1 takes 45 minutes to run end-to-end on partially dedicated space. Option 1S has fully a dedicated right-of-way and a 35-minute run time.
- The Red Line’s mode may not have a big impact in boosting its potential speed and impact on access to opportunity. We compared existing transit lines and found that when controlling for right-of-way, light rail service and BRT service run at similar speeds.
- The three alignments under consideration would have similar effects on access to opportunity for Baltimore as a whole and in boosting transit equity by targeting underserved populations across Baltimore. Therefore, to decide the preferred option, MDOT should weigh the viability of dedicating right-of-way along each alignment.
- Of the Red Line scenarios MDOT is considering, Baltimoreans would benefit the most from Option 1, which includes portions of dedicated right-of-way. Option 1 has higher speeds over dedicated segments, which would enable people to reach more jobs in an hour compared to the other options. The differences in alignment between Option 1 and the other scenarios have a minimal impact on access to jobs.
- A Red Line that runs entirely on its own right-of-way would have the most benefits for Baltimore, by far. We found that Red Line Option 1S would increase access to jobs for residents of the vulnerable population areas by up to 7% percent. This is much higher than the access gains for Baltimore residents after the 2018 bus network redesign or for residents of Toronto after the addition of a brand new subway line. The gains in access are due to the fully dedicated right-of-way, which would dramatically speed up the service.
- MDOT isn’t publicly considering giving the entirety of the Red Line its own right of way, but it should, in order to ensure the Red Line is a truly transformational project for Baltimore.
Appendix – Analysis assumptions
Study Area
Our analysis covers the urbanized Baltimore region as defined by the Census’ Bureau’s urban area definition, and includes block groups that fall within a 2-mile buffer of the urban area in order to limit the size and scope of the analysis to urban areas while also capturing exurban fringes. Access to opportunity measures computed in this report include destinations located anywhere in the area, travel times were computed from each block group centroid to all other block group centroids in the area.
When considering the equity impacts of changes in access, we narrowed our focus on areas of Baltimore with higher levels of marginalization. Areas with a vulnerable population index of 5 or greater were chosen as the area of impact when considering demographic differences in benefits and access for the project.
Schedule and speed assumptions
To analyze the potential impact of the Red Line scenarios, we wrote prospective transit schedules to represent the service that each Red Line scenario would offer, using IBI’s GTFS editor tool.
We assumed that each scenario would operate 10-minute frequencies during rush hour (6-9am and 3-7pm on weekdays) and 15-minute frequencies during the rest of service.
To determine run time, we identified existing projects that operate in the right-of-way settings that are being considered for the Red Line scenarios. We used Google Maps trip planner to identify their scheduled travel times (including dwell time) & distance covered, to calculate average speeds. We applied the average speeds for dedicated ROW and surface-level light rail accordingly to the Red Line scenarios.
 States Are Biased Toward Road Spending. Baltimore Advocates Are Out to Change That.
A new coalition of environmental, labor, and business leaders is working with elected officials in Baltimore to pass the Transit Safety and Investment Act, a bill currently moving through the Maryland state legislature. The bill would require the Maryland Department of Transportation, which oversees the Maryland MTA, to spend millions more annually on MTA maintenance and operations over the next five years
Read More Derailed: How Nashville’s Ambitious Transit Plan Crashed at the Polls— And What Other Cities Can Learn From It
Our new report, “Derailed,” examines how Nashville's 2018 transit referendum was weakened by rushed, insular planning that produced a transportation package out of touch with the needs and desires of Nashville residents.
Read More