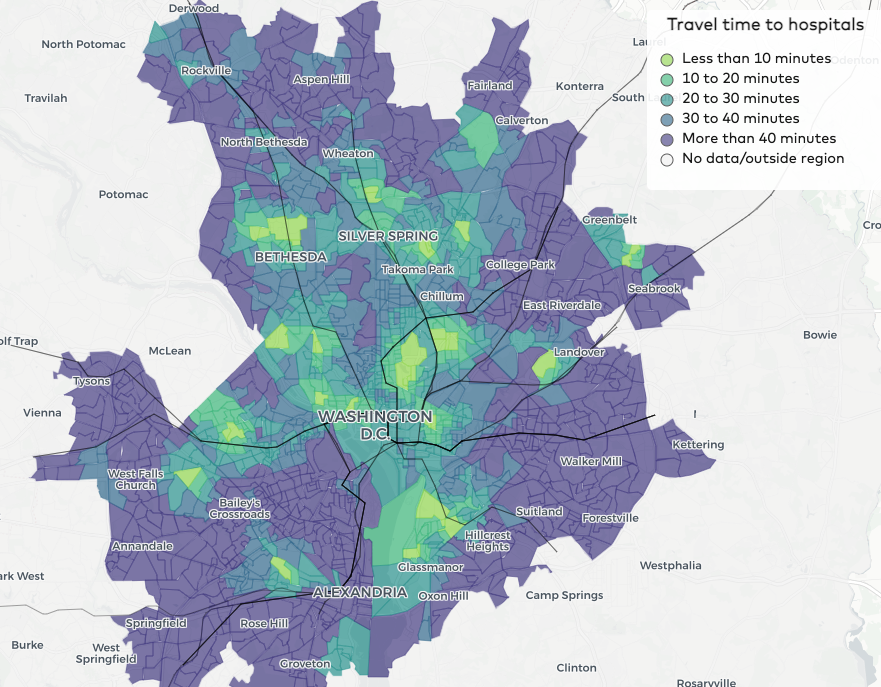
The Transit Equity Dashboard is TransitCenter’s new tool that visualizes disparities in transit access across race, class, and other characteristics in six major US transit regions. By measuring these disparities, the dashboard can help transit agencies and local governments craft transportation and land use policies that make transit access more equitable.
There’s a lot to explore in the dashboard. In this video tutorial, TransitCenter’s Mary Buchanan, who led its development, gives an overview of its features:
The tutorial can get you started interpreting the dashboard’s charts measuring disparities in transit access and travel time, and using the maps to:
- Visualize changes in transit access to jobs and other destinations over time
- Evaluate transit access to hospitals
- Compare travel times on transit to travel times in a car
- Assess how transit access diminishes for riders who can’t afford premium fares
- Add layers of demographic information to the geographic visuals of transit access
You can also hear more about the dashboard in the latest episode of High Frequency, where TransitCenter’s Kapish Singla interviews Mary and Greater Greater Washington’s Ron Thompson about what the dashboard reveals.
 On the Brink: Will WMATA’s Progress Be Erased by 2024?
The experience of being a WMATA rider has substantially improved over the last 18 months, thanks to changes the agency has made like adding off-peak service and simplifying fares. Things are about to get even better with the launch of all-door boarding later this fall, overnight bus service on some lines starting in December, and an ambitious plan to redesign the Metrobus network. But all of this could go away by July 1, 2024.
Read More To Achieve Justice and Climate Outcomes, Fund These Transit Capital Projects
Transit advocates, organizers, and riders are calling on local and state agencies along with the USDOT to advance projects designed to improve the mobility of Black and Brown individuals at a time when there is unprecedented funding and an equitable framework to transform transportation infrastructure, support the climate, and right historic injustices.
Read More