
Are you a transit advocate in need of data to support your case for a bus network redesign in your city? A journalist looking to compare regional transit spending and service provision? Transit data enthusiast and/or map nerd?
If so, check out this tutorial for our new National Ridership map, presented by our graduate fellow, Mary Buchanan. It uses Census and National Transit Database data to explore changes in transit ridership, for the largest metropolitan areas in the US, from 2006 to 2015.
Let’s get mapping!
 On the Brink: Will WMATA’s Progress Be Erased by 2024?
The experience of being a WMATA rider has substantially improved over the last 18 months, thanks to changes the agency has made like adding off-peak service and simplifying fares. Things are about to get even better with the launch of all-door boarding later this fall, overnight bus service on some lines starting in December, and an ambitious plan to redesign the Metrobus network. But all of this could go away by July 1, 2024.
Read More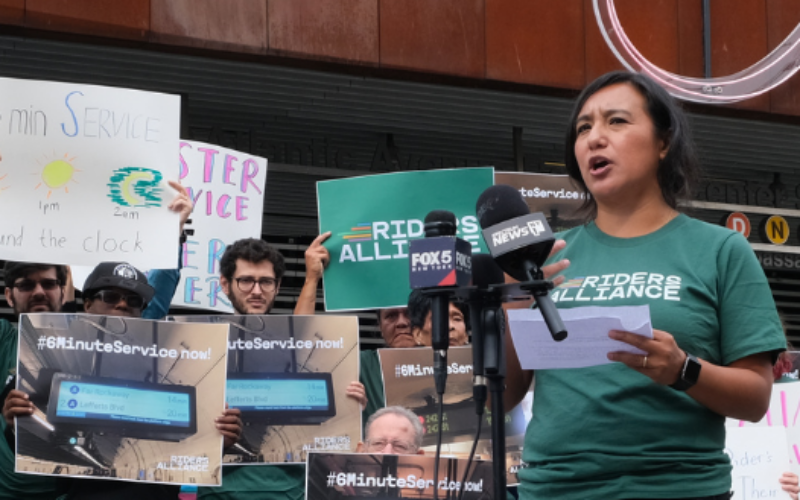 Built to Win: Riders Alliance Campaign Secures Funding for More Frequent Subway Service
Thanks to Riders' Alliance successful #6MinuteService campaign, New York City subway riders will enjoy more frequent service on nights and weekends, starting this summer. In this post, we chronicle the group's winning strategies and tactics.
Read More