As a follow-up to our post about how to download and interact with National Transit Database (NTD) ridership data, we further explore how to interpret and use this data. While myriad factors govern whether people opt to ride transit in your city, there are distinct patterns we’ve seen in our work with transit agencies across the country.
Riders are generally attuned to how their transit agency is performing based on how useful — or unbearable — their trips are. In turn, they tend to vote with their fare cards. People take transit where fast, frequent transit is available, and avoid it where it isn’t. Thus, dwindling ridership is very likely a symptom indicating a need for system improvements. On the other hand, if ridership is through the roof, calls for more service are necessary. It falls to advocates like you to help push transit operators and city leadership to make changes. Sharing ridership measures with agency officials, the press, and the public will lay a factual foundation for your message and underpin the general public conversation about transit in your city.
Here are three of the simplest ways to use ridership and performance data in your advocacy:
One basic measure of the health of a transit network is whether riders choose to use it. People will find an alternative way to get around when service is reduced to the point where it isn’t convenient. Rather than fearing that low ridership undercuts calls for restored transit investment, on-the-ball advocates can use it to argue for even more investment to make transit useful and relevant for a city’s traveling public. The NTD has provided monthly ridership data of every transit agency operating in the US since 2002, making it a great resource for advocates to evaluate long-term ridership trends. This is a particularly important asset for advocates hoping to understand and communicate the impact on ridership of service cuts, scaled back maintenance or fare hikes.
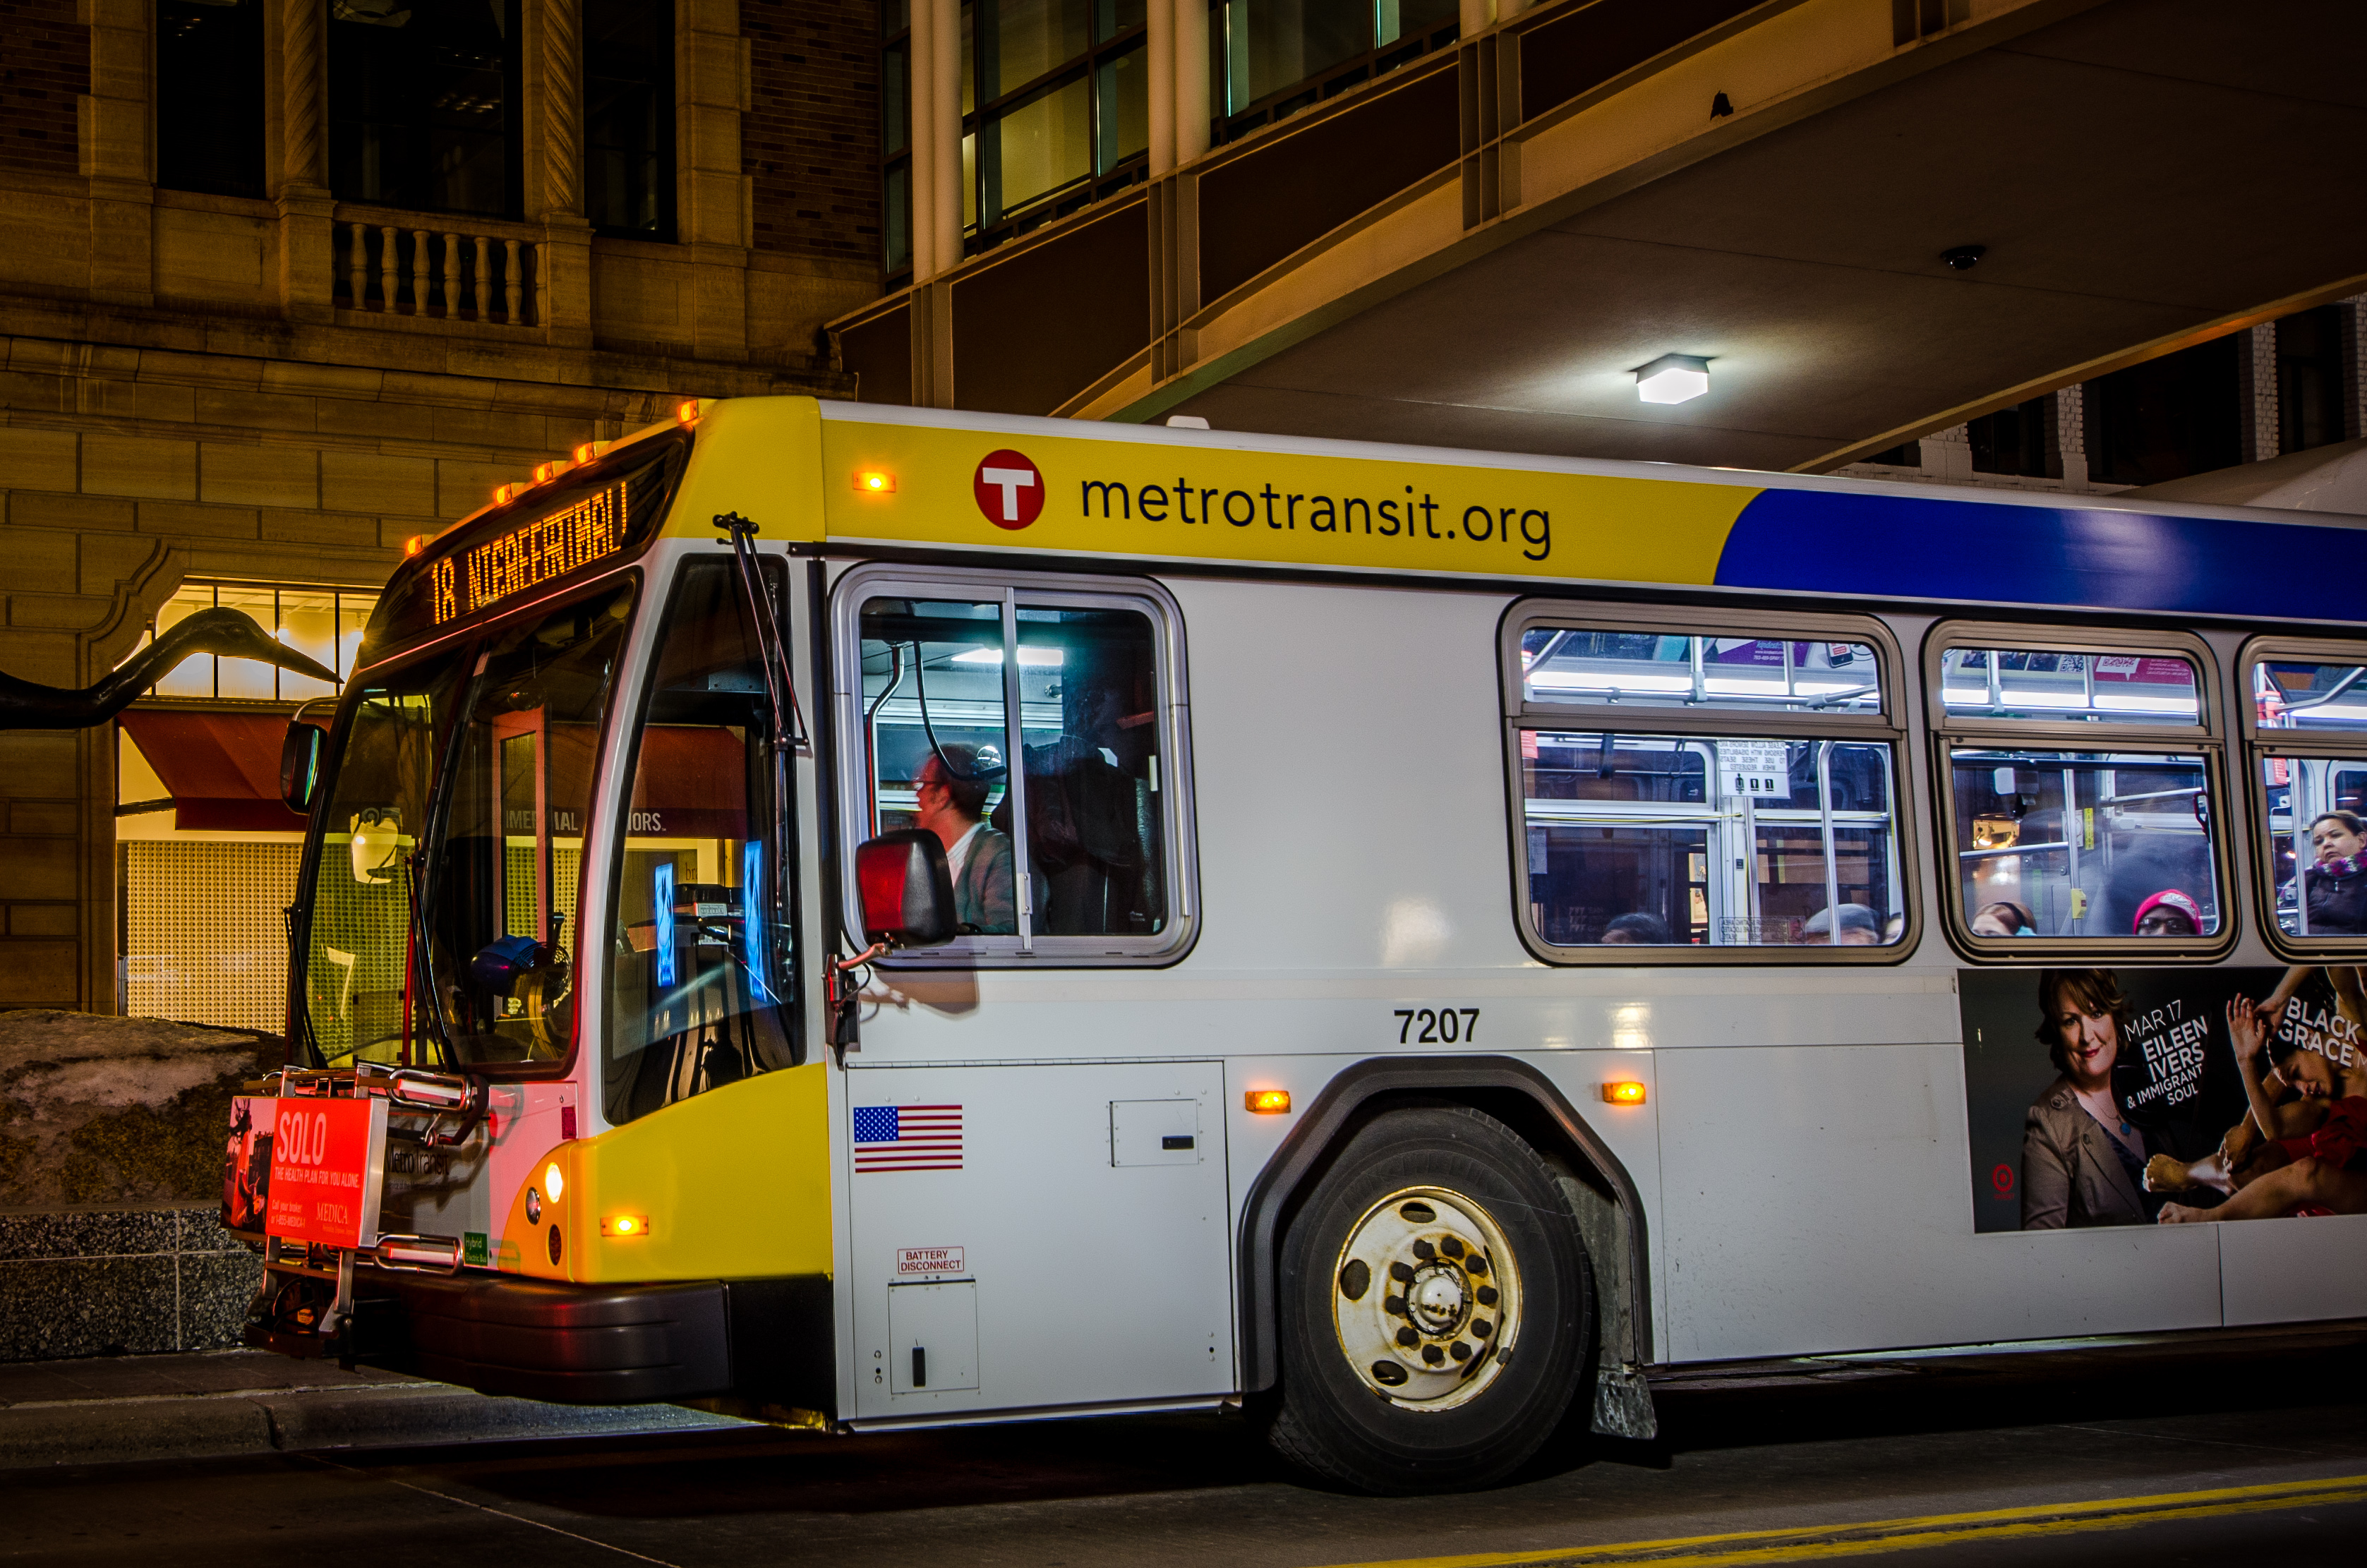
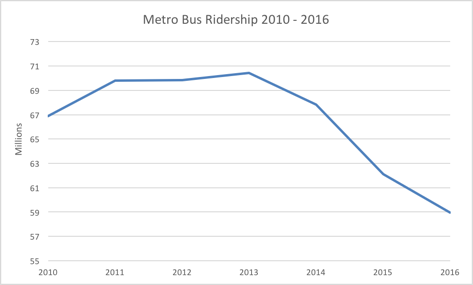
To get a rough sense of where your agency’s priorities lie, compare ridership on different transit modes. Let’s use Minneapolis-St. Paul as an example. According to NTD data, ridership on Metro Transit, the Twin Cities’ primary transit operator, fell roughly 4 percent last year. This seems paradoxical: Beginning in 2004, the region began investing heavily in its light rail system. Indeed, light rail ridership increased 50 percent in 2014 with the opening of the METRO Green Line, and 44 percent in 2015, before essentially flatlining last year. A quick look at Metro’s bus ridership, however, explains the overall trend. Last year, Metro’s buses lost 5 percent of their riders compared to 2015. In fact, bus ridership has fallen roughly 12 percent since 2010!
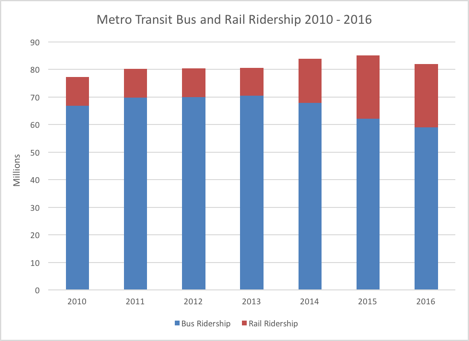
As this graph shows, bus ridership has been declining as a proportion of total transit ridership in Minneapolis-St. Paul.
In Minneapolis-St. Paul, we see a clear example of a common national trend: rail ridership soaring while bus ridership tanks. We can expect a certain number of bus riders to switch to rail if an option like METRO’s Green Line is more convenient. But in most cases, riders don’t simply give up on buses that already meet their needs. Along with Los Angeles, Philadelphia, and many other cities, Minneapolis-St. Paul appears heavily focused on building rail projects while paying scant attention to improving its bus network. With declining bus ridership numbers in hand, advocates are well equipped to push leadership to determine exactly how and where Metro’s buses are failing and to take the necessary actions to turn them around.
Children in snowy Minneapolis regularly slide down slopes like these.
You should also compare your agency’s ridership against your city’s population. In a healthy network, ridership may track or outpace other measures of city growth. But falling ridership in a growing city is a bad sign. By this measure, overall transit ridership in the Twin Cities is doing well. At a time when the population of the seven-county region grew 5.5 percent from 2010 to 2015, combined ridership on Metro’s rail and bus networks increased roughly 10 percent. Though again, Metro’s buses saw a 7 percent decline in ridership. Growth on rail that is outpacing population is an encouraging sign, but advocates should continue to push agency leadership to address the city’s bus system.
While there is so one-size-fits all diagnosis for a transit agency’s performance, the Twin Cities provide a sound case study for the types of simple analyses that advocates can and should be using to effectively assess their local transit systems.
 On the Brink: Will WMATA’s Progress Be Erased by 2024?
The experience of being a WMATA rider has substantially improved over the last 18 months, thanks to changes the agency has made like adding off-peak service and simplifying fares. Things are about to get even better with the launch of all-door boarding later this fall, overnight bus service on some lines starting in December, and an ambitious plan to redesign the Metrobus network. But all of this could go away by July 1, 2024.
Read More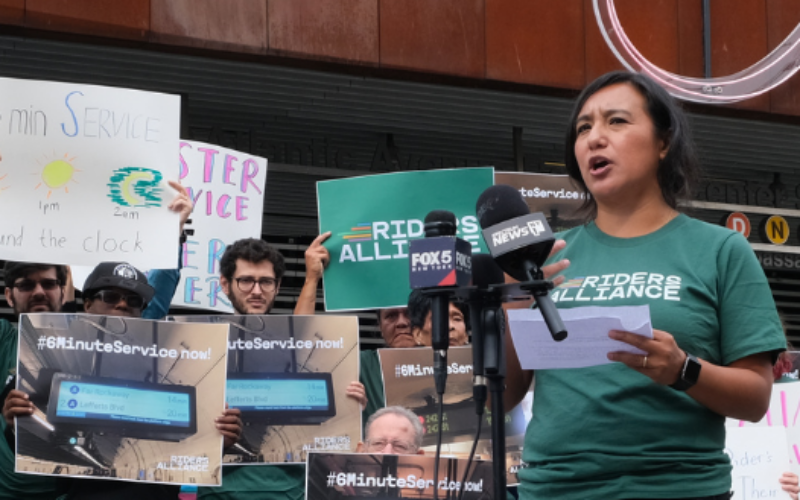 Built to Win: Riders Alliance Campaign Secures Funding for More Frequent Subway Service
Thanks to Riders' Alliance successful #6MinuteService campaign, New York City subway riders will enjoy more frequent service on nights and weekends, starting this summer. In this post, we chronicle the group's winning strategies and tactics.
Read More