The MBTA's high profile system interruptions in 2022 overshadowed the potential benefits of marquee transit projects like the Green Line Extension.
Our Equity Dashboard evaluates how well Boston residents could access essential destinations like healthcare, jobs, and grocery stores via public transit from February 2020 (right before the pandemic hit) through early August 2022.
The dashboard confirms how tough of a year 2022 was for Boston’s transit riders, when an MBTA workforce shortfall and high-profile train breakdowns cut into service and endangered riders. Our data quantifies the degree to which accompanying service changes narrowed transit access for Boston riders, and how access differed across race, income, and other metrics.
The dashboard also surfaces longstanding access inequities in Boston that predate COVID. Of Boston’s residents, Black people, Latinx people, and people with limited means are consistently more likely to commute by public transit and less likely to drive. But these groups can access far fewer destinations than wealthier, White Bostonians can. Access to a car affords Bostonians magnitudes better access than public transit does. The region’s drivers can get to over 1.5 million jobs in 45 minutes – 15 times more jobs than one can get to by public transit.
Note: The Equity Dashboard is powered by transit schedules and doesn’t capture unscheduled delays, disruptions, or cancellations. The data likely overestimates the access of Boston riders at times but gives important insight into how the MBTA intended to operate transit service.
2022 successes overshadowed
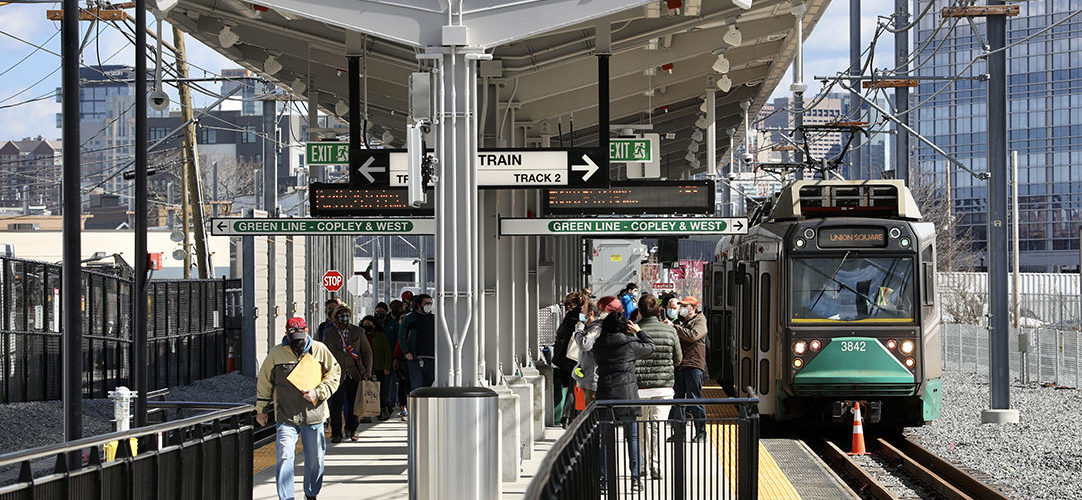
In the past year, the MBTA has completed marquee projects like the Columbus Avenue busway and the Green Line Extension. After it opened in March, people who live within walking distance of the Green Line’s new Union Square station had access to 8% more jobs by transit within 45 minutes (though demographic changes and displacement have pushed away much of the environmental justice population the line was originally intended to serve).
Sadly these improvements weren’t enough to counteract the systemwide reductions undertaken over the same period. A 20% vacancy rate agency-wide – including acute shortfalls of operators and dispatchers – lowered the MBTA’s capacity to provide service, and it pared back its schedules significantly. We found that the average Bostonian had access to about 10% less transit service (measured as transit trips stopping within walking distance of home) in 2022 from a high point in September 2021.
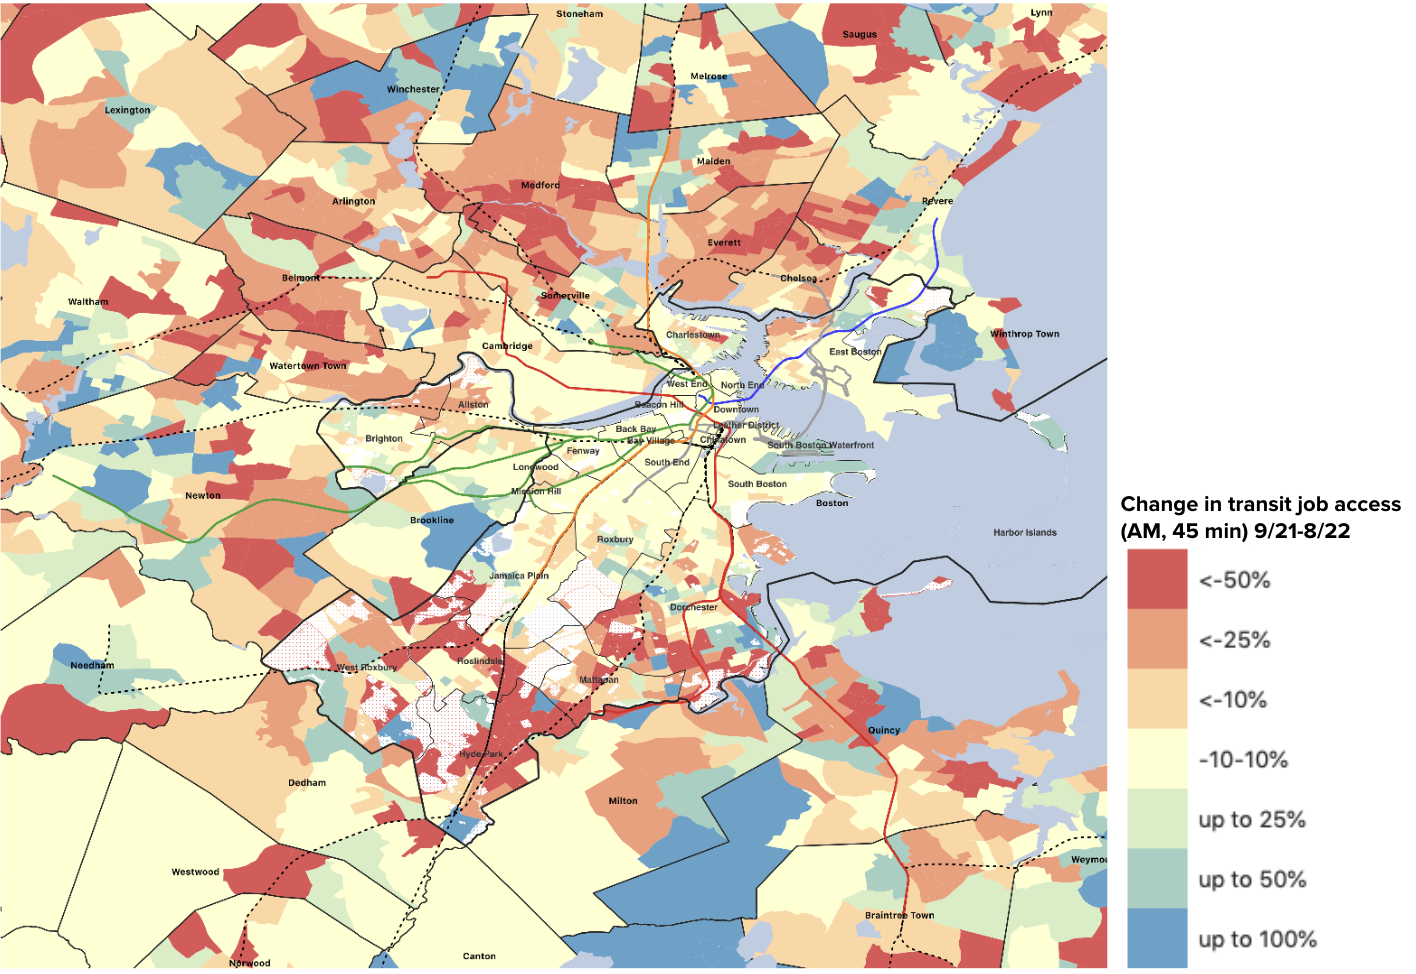
From September 2021 to August 2022 (before the Orange Line shutdown), access to jobs decreased by 10.5% across the Boston MSA. Most of the region and its residents can get to less by transit now than they could last year. The communities of Dorchester, Mattapan, Chelsea, Everett, Hyde Park, and Rosindale were particularly affected by cuts.
Highwater access moments show what’s possible
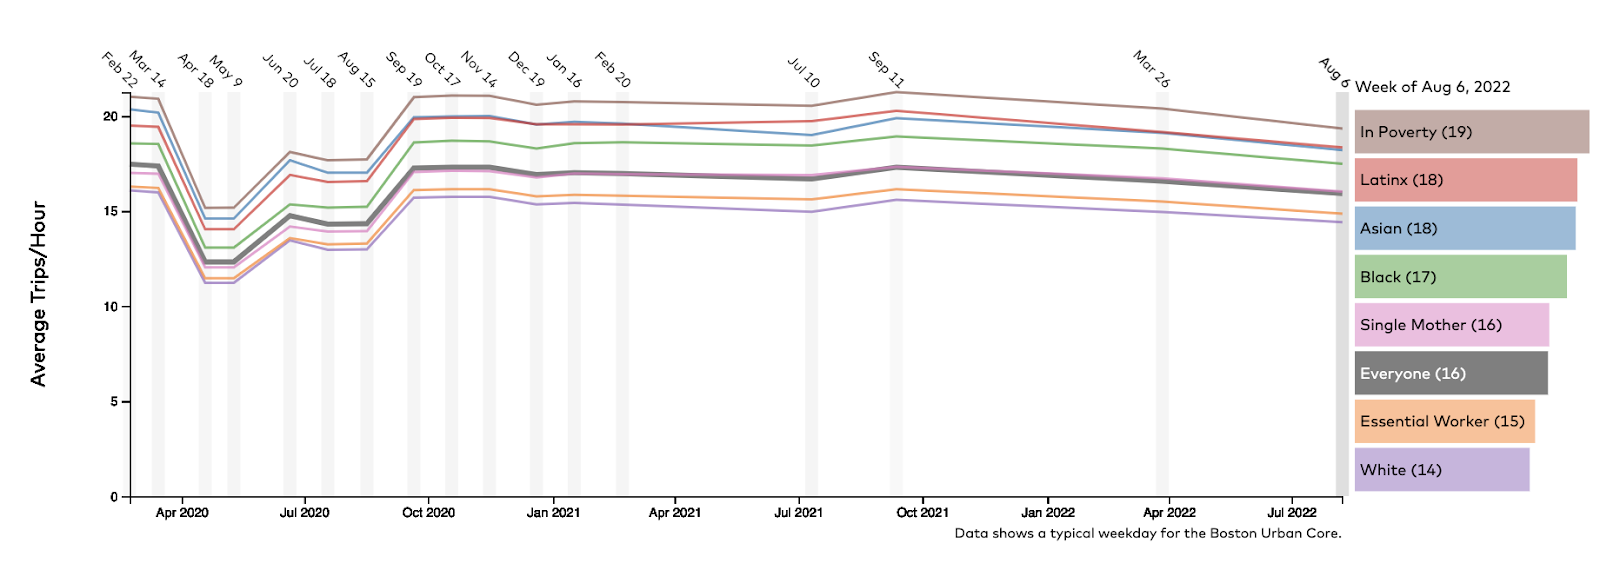
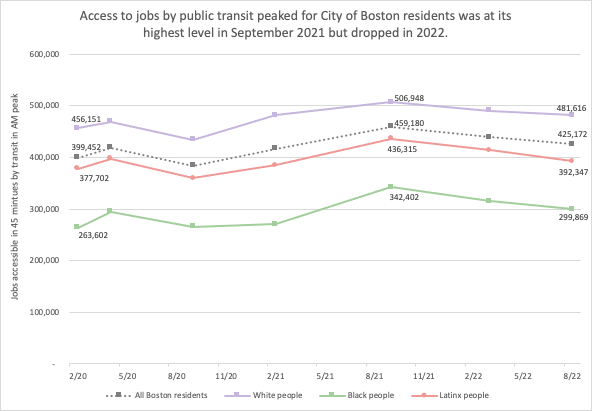
Throughout 2020 and 2021, the T excelled at reorienting its limited service to routes where people were still riding. These service adjustments substantially improved access by transit in the region. By September 2021, the average Boston resident could reach almost 60,000 more potential jobs by transit – an increase of 20% – compared to before the pandemic. Accessibility grew the most for Black residents, who could reach about 80,000 more potential jobs by transit than they could in February 2020.
But the MBTA’s constant crisis response last year dented its progress on racial equity. In August 2022, the average Boston resident could reach 34,000 fewer jobs by transit compared to the previous year; the average Black or Latino resident lost access to even more – about 43,000 jobs over the same period. Overall, job access by transit was still higher than before the pandemic.
Note: Our data ends before capturing significant events in the fall: less delay on the Orange Line train, a new permanent bus priority lane, and several stations opened upon completion of the Green Line Extension.
Economic and racial inequity underlie the MBTA’s network
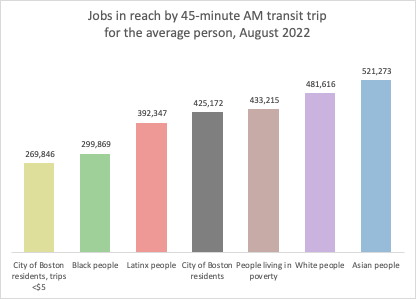
The dashboard shows that the best transit access in Boston costs a premium and excludes those who can’t afford it. Local bus and subway service costs under $2.50 per ride. The commuter system provides direct connections from some neighborhoods and suburbs to the region’s large job centers, for up to $13 one way. This tiered system means that a lot of what’s technically transit-accessible costs well more than base fares to reach — and in reality, is only accessible to those who can afford it. Boston transit riders with a $5 budget for their trip can reach two-thirds of the jobs that wealthier riders can.
Black and Latinx people have worse outcomes by transit despite their comparatively high transit ridership. This mismatch is the starkest in the city of Boston: for every ten jobs a white or Asian person can get to by transit, a Latinx person can reach eight, and a Black person can reach six. The average Boston resident had a 20-minute scheduled transit trip to the nearest hospital, but Black and Latinx people’s journeys were scheduled to take almost 3 minutes longer.
This disparity is etched into land use, housing costs, and transportation planning. Many neighborhoods rich in jobs and low-fare transit are among the region’s most expensive – like Back Bay, the South End, Beacon Hill, and Cambridge. High housing costs and historic segregation have kept many people with low incomes and people of color away from the best transit. Chinatown, in Boston’s Downtown, is a notable exception, as a highly transit-accessible neighborhood with a majority of Asian residents.
Meanwhile, the MBTA has forgone running service on existing transit infrastructure in some working-to-middle-class neighborhoods.
Hyde Park, a predominantly Black and brown neighborhood, is an example. On weekdays, over 40 trains travel through Hyde Park station en route to and from downtown on the Franklin/Foxboro Line. Only eight trains stop, all outbound and between 3-7pm. Hyde Park is among the least accessible urban neighborhoods. In August, the average commuter from Hyde Park could get to about 50,000 jobs in 45 minutes, and under 25,000 jobs by trips that cost less than $5. That’s about a tenth of what the average Boston resident can reach, and is similar to transit access in a suburb like Melrose or a Gateway City like Lynn.
How can transit decision-makers in Boston turn things around?
The MBTA made the correct but difficult call last year to pare back service given operator vacancies. Otherwise, access by transit would still have fallen but been even less reliable, due to high trip cancellation rates. But schedule cuts were intended to bridge the operations gap temporarily. Unfortunately, it’s growing, with 350 bus driver vacancies this month, up from 300 in November.
In the immediate future, the MBTA must focus on hiring and retaining workers. Without a complete workforce, it can’t plan for a more equitable system, provide high-quality service, or safely maintain its infrastructure. The pandemic exacerbated the challenges of transit agency jobs and accelerated burnout nationwide. Like other transit agencies, the MBTA should pursue better job conditions, pay, and benefits. LA Metro also faced a large operator shortfall and cut service last winter. Over the summer, it approved higher salaries for bus drivers and has gradually restored cut trips as its crew of operators has grown.
Major funding sources can support these crucial investments in Boston’s transit workforce, infrastructure, and operations — should local and state leaders take advantage of them. A newly-passed “millionaire tax” will generate $1.3 billion that must be spent on public education, roads, bridges, or public transportation. The Infrastructure Investment and Jobs Act (IIJA) generated capital funding that can be put towards improving everyday travel for Boston riders: upgrading bus stops, purchasing train cars, and expanding bus depots. At the discretion of the state DOT, millions of dollars of highway funding, set aside by the IIJA, can be redirected to support transit projects instead.
Other developments point to a brighter 2023 for public transit in Boston. Starting this year, the MBTA Communities Law will require municipalities served by the MBTA to zone for multi-family housing. As long as municipalities meet their legal obligation, a larger, more varied housing supply should make living in transit-accessible communities more affordable and attainable. Ultimately, the law can help reverse the displacement of transit riders from accessible neighborhoods.
Commuter rail improvements are overdue and would supercharge the impacts of this law. Advocates have long urged for operating commuter rail lines more like subways, with more frequent, cheaper, and local service along the railroad. Such changes would greatly improve accessibility from the diverse communities along the commuter rail network, including outlying urban neighborhoods, streetcar suburbs, and Gateway Cities.
As the agency begins implementing its bus network redesign, the MBTA can redress disparities in transit access, realign service with new post-COVID ridership patterns, and increase bus service systemwide. Dedicated busways improve speed and reliability; local governments have and should continue to work with the MBTA to expand the region’s network of bus-only lanes along high-priority routes and congested streets.
Transit-friendly administrations now front the state of Massachusetts and many of its local governments, including the City of Boston. Underpinned by vocal and visionary advocacy, now armed with political backing, public transit in the Bay State is primed for essential and ambitious reforms and investment. Now the hard work of undoing decades of inequity begins.