You asked and we listened – we’ve made the raw data from our recent transit ridership analysis publicly available! A spreadsheet of national transit ridership data from 2002-2017 can now be found here.
As always, feel free to reach out to TransitCenter at [email protected] with any feedback or questions.
A few things to consider when using these data:
Data source: All data are annual summaries based on the U.S. Department of Transportation’s “National Transit Database (NTD)” Monthly Module Adjusted Data Release, December 2017, accessed in late February 2018. Population data are also drawn from NTD. Population for urbanized areas (UZAs) represent 2010 census estimates.
Transit agency service area populations are reported by the agencies themselves—while the vast majority of agencies have updated population data with 2016 estimates, many have not (this is indicated by an astrisk in the relevant data column; for full details, see the Monthly Module Adjusted Data Release, linked above).
TransitCenter takes responsibility for any misrepresentation or mistakes made in analyzing these data from the NTD.
Citing this work: Please credit TransitCenter for this analysis if you cite it directly (i.e. without reproducing it on your own).
Additional resources: The NTD Glossary is a valuable resource for anyone using these data.
For an explanation about how to use the NTD database, check out TransitCenter’s February 2017 video, “Fun with the National Transit Database.”
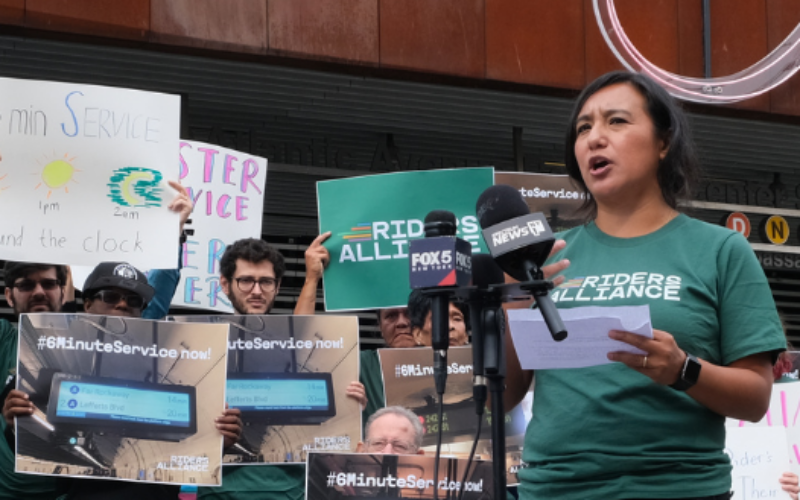
 Built to Win: Riders Alliance Campaign Secures Funding for More Frequent Subway Service
Thanks to Riders' Alliance successful #6MinuteService campaign, New York City subway riders will enjoy more frequent service on nights and weekends, starting this summer. In this post, we chronicle the group's winning strategies and tactics.
Read More A Transit Revolution in Philadelphia?
The Southeastern Pennsylvania Transportation Authority (SEPTA) has been working throughout the pandemic on several system-wide planning initiatives that have the potential to transform transit service in and around the city of Philadelphia.
Read More