
“CHARLOTTE SKYLINE” BY JAMES WILLAMOR IS LICENSED UNDER CC BY-SA 2.0
In a recent post, we surveyed the clash of city and state transportation ambitions in North Carolina. Charlotte, Raleigh, and other cities are seeking new transit service to take full advantage of the Tar Heel State’s breakneck rate of urban growth. But the state government continues to build and widen highways like it’s 1956, while imposing an onerous funding cap on some transit projects.
We took a further look at the current transit situations in Charlotte and Raleigh, the state’s two largest cities, using the AllTransit tool. One of the advantages of AllTransit is its ability to analyze transit quality citywide and at the neighborhood level.
In both cities, transit varies significantly in quality from neighborhood to neighborhood. The granular information about these differences reveals practical barriers to transit use, since few people are likely to live, work, and play in areas that are all well served by transit.
Charlotte
At just under 300 square miles, Charlotte’s land area is about the same as New York City’s but contains just one-tenth as many people. Overall, the city achieves a 4.3 out of 10 for its AllTransit Performance Score. This ranking includes block groups in Charlotte that are not close to any sort of transit service, which appear in white below.
AllTransit doesn’t merely display the city’s overall score; it also notes the distribution of Performance Scores for every block group in the city.

In all, 58.3 percent of the city’s residents are in areas with scores below 5 and nearly one in eight is in a neighborhood with a score below 1. Residential neighborhoods with high Performance Scores do exist, though—10.8 percent of the population lives in areas scoring 7 or better. Overall, the most common score is about 5.2.
These findings show that there is a great range of Performance Scores across Charlotte. But they left a lingering question: what might the actual experience of using transit look like in places with each of these scores?
The Most Common Score: 5.2 | Street: East Worthington Ave. | Neighborhood: Dilworth
The most common AllTransit Performance Score for a Charlotte census block is 5.2. East Worthington Avenue, in the prosperous, somewhat grid-patterned inner-ring neighborhood of Dilworth, is one such block.
Worthington Avenue is less than three miles from the central business district. Transit service exists to an extent that those seeking it out could use it, but isn’t so plentiful that it would be anyone’s first choice. The closest bus line, the #6, only passes near Worthington in the outbound direction. The inbound route is three-quarters of a mile away–not an impossible distance to walk–but the bus only runs three times per hour during the rush and twice per hour the rest of the day. On average, the four bus lines within half a mile of Worthington run once per hour throughout the week.
The Average Score: 4.3 | Street: Broken Saddle Ln. | Neighborhood: Old Farm
Broken Saddle Lane, a cul-de-sac about seven miles southeast of the urban core, is by AllTransit’s calculation in a perfectly average block group in terms of Charlotte transit quality. It has a more suburban feel than Worthington Avenue, with larger houses on larger lots and a proliferation of culs-de-sac. A person traveling from Broken Saddle has a choice of three bus lines during rush hour on nearby Providence Road but only one during the rest of the day. None runs more often than three times per hour. Moreover, there is no shelter on Providence Road—just a signpost in the ground, making it unpleasant to wait for the bus on a hot summer day or in the rain.
The High-Quality Score: 9.2 | Street: Rensselaer Ave. | Neighborhood: South End
Rensselaer Avenue, in the South End neighborhood, performs about as well as any street in Charlotte on the AllTransit Performance Score (a few blocks in the central business district score slightly higher). It is walking distance from the LYNX Blue Line light rail, as well as the #10 and #16 buses, both of which run four times per hour most of the day.
With this level of service, a person could conceivably live on Rensselaer and never use a car, but only if the majority of their travel was to destinations that were in areas of comparable transit quality. As the map above shows, those bright yellow neighborhoods are a fairly small part of the city.
Another notable shortcoming of Rensselaer: few people actually live there. According to Census Bureau data, the block group comprises fewer than 700 commuters, many of whom live in apartment buildings constructed within the last 15 years.
Raleigh
Raleigh has an identical AllTransit Performance Score to Charlotte: 4.3. Its population density is also similar to Charlotte’s, with about 423,000 people in 145 square miles. Unsurprisingly, the pattern of transit service also mirrors North Carolina’s largest city.
In Raleigh, 57 percent of the population lives in an area with a score below 5, and one in nine lives in an area with a score below 1. 12.2 percent of Raleigh residents live in areas scoring above 7, a slightly larger proportion than in Charlotte. The most common score, 5.2, is nonetheless the same.

Like Charlotte, Raleigh’s high-quality transit service is concentrated in the downtown core, where few people live. Census tract 501, which encompasses Raleigh’s city hall, contains the only block group in the city that scores higher than 9. But just 2300 people, or 0.5 percent of the city’s population, lives there. The immediately adjacent census tracts, which all score between 7 and 9, together account for 58 percent of the entire city’s population that lives in proximity to such high-quality transit.
Simply, concentrated transit in Raleigh is not concentrated where people live. The Go Raleigh service map provides a sense of the degree to which service is spread thin, keeping in mind that all of the reasonably reliable service closely surrounds the boxed downtown.
For a more detailed look, AllTransit can also visualize the number of trips per week available across each city (on top, Charlotte, and below, Raleigh).


As the charts show, more than 85 percent of people in Charlotte and 84 percent of people in Raleigh live in areas with fewer than 1,250 nearby transit trips per week—about the equivalent of a single bus line running in both directions every 15 minutes or two bus lines every 30 minutes (or, more likely, four bus lines that run once per hour). Just 8.3 percent of Raleighites and 4.1 percent of Charlotteans have access to more than 2,500 transit trips per week, versus 38.8 percent of people in Atlanta and 95.3 percent of New Yorkers.
One lesson resulting from AllTransit’s analysis of Charlotte and Raleigh is that a “pretty good” transit score like 5 or 6 is still probably too low to create communities of frequent transit riders. Note, for instance, the number of transit trips and routes available at each location, and the resulting service frequency (a “trip” is defined as one instance of a bus or train stopping within half a mile).
| Location (AllTransit Performance Score) | Trips Per Week | # of Nearby Lines | Combined Frequency On All Nearby Lines |
| E. Worthington Ave. (5.2) | 694 | 4 | Every 15 minutes |
| Broken Saddle Ln. (4.3) | 267 | 4 | Every 38 minutes |
| Rensselaer Ave. (9.2) | 2,307 | 25 | Every 4.4 minutes |
| TransitCenter’s NYC HQ (10) | 27,793 | 54 | Every 22 seconds |
Near Worthington Avenue, the first bus traveling anywhere takes on average 15 minutes to arrive, and 38 minutes near Broken Saddle Lane. Rensselaer fares significantly better, though for comparison a bus or a train there still arrives 12 times less frequently than in lower Manhattan.
In Raleigh, the trips per week metric shows a concentration of relatively frequent service to the west and southwest of downtown and a dearth to the east, despite the fact that some parts of eastern Raleigh have relatively high Performance Scores. Outside of downtown, the best performers are the census tracts south of Hillsborough Avenue, where NC State University is located. While the university is served by four GoTriangle bus lines, the high number of available trips is probably thanks to the Wolfline, the free university-operated bus service, which circulates the campus and connects to higher frequency corridors for service to downtown. Seven of the Wolfline’s twelve routes provide service every 15 minutes or more during peak hours.
Notably, high-frequency transit service in Raleigh does seem to correlate with higher rates of walking in those same areas. This makes intuitive sense, and is borne out by the maps below:
This shows the importance of integrated multimodal planning as both Charlotte and Raleigh work to develop more robust transit systems. Fortunately, voters in Raleigh are likely to see a measure to fund local transit improvements on their ballots this fall. The plan developed by Wake County would triple bus service, increase the frequent bus network from 17 to 83 miles, and build a commuter rail line. But the state’s regressive transportation policies are likely to keep anything but the most modest projects from moving ahead in the foreseeable future.
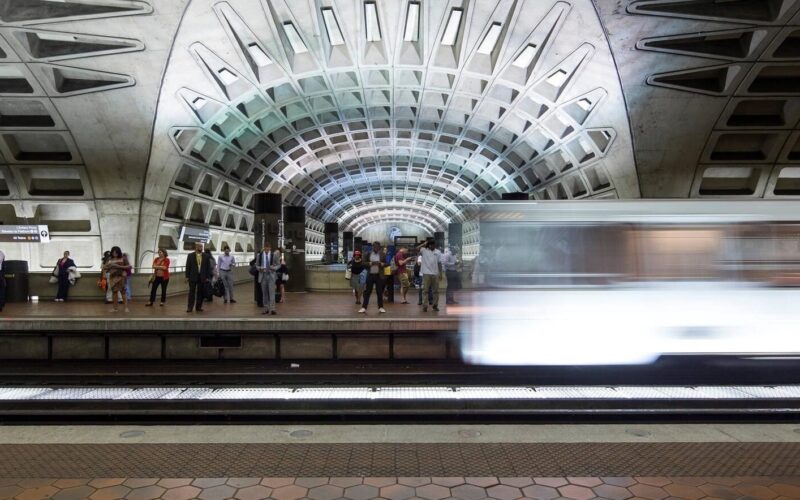 On the Brink: Will WMATA’s Progress Be Erased by 2024?
The experience of being a WMATA rider has substantially improved over the last 18 months, thanks to changes the agency has made like adding off-peak service and simplifying fares. Things are about to get even better with the launch of all-door boarding later this fall, overnight bus service on some lines starting in December, and an ambitious plan to redesign the Metrobus network. But all of this could go away by July 1, 2024.
Read More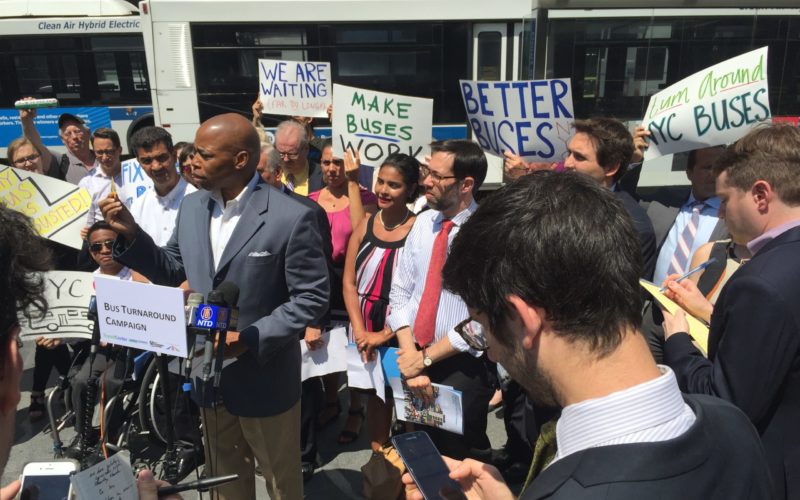 A Bus Agenda for New York City Mayor Eric Adams
To create the “state-of-the-art bus transit system” of his campaign platform, Mayor Adams will have to both expand the quantity and improve the quality of bus lanes. We recommend these strategies to get it done.
Read More