

The transit fortunes of Columbus have been remarkably different than that of its neighbor, Cleveland.
The current story of American transit is one of ridership decline. But this national trend masks significant local variation — some transit agencies have grown ridership even in an era of cheap gas and easy car loans. As we like to say, “all ridership is local.”
Understanding why ridership is rising in some places but not in others is critical to formulating effective transit policy. And to gain that understanding, advocates, researchers, and policy makers need access to useful data on local ridership trends, service characteristics, and demographics.
That’s why we’ve created Transit Insights, a new tool that combines information from the National Transit Database, the U.S. Census, and the route maps at Transit.Land into a visual format that allows for quicker, easier reference than querying multiple databases. The site is currently in public beta, and we welcome feedback on how to improve it.
To illustrate the capabilities of Transit Insights, let’s look at the diverging transit fortunes of two Ohio cities. Faced with the same federal and state funding obstacles, Columbus and Cleveland have experienced remarkably different transit ridership outcomes over the past decade. Using Transit Insights, you can delve into the factors that explain the ridership difference between these two places.
Transit ridership at the Central Ohio Transit Authority in Columbus (COTA) grew 25% from 2006 to 2017 (and climbed even further in 2018 following a bus network redesign). But a hundred-odd miles northeast, ridership at Cleveland’s beleaguered Greater Cleveland Regional Transit Authority (GCRTA) has fallen by half over the same period.
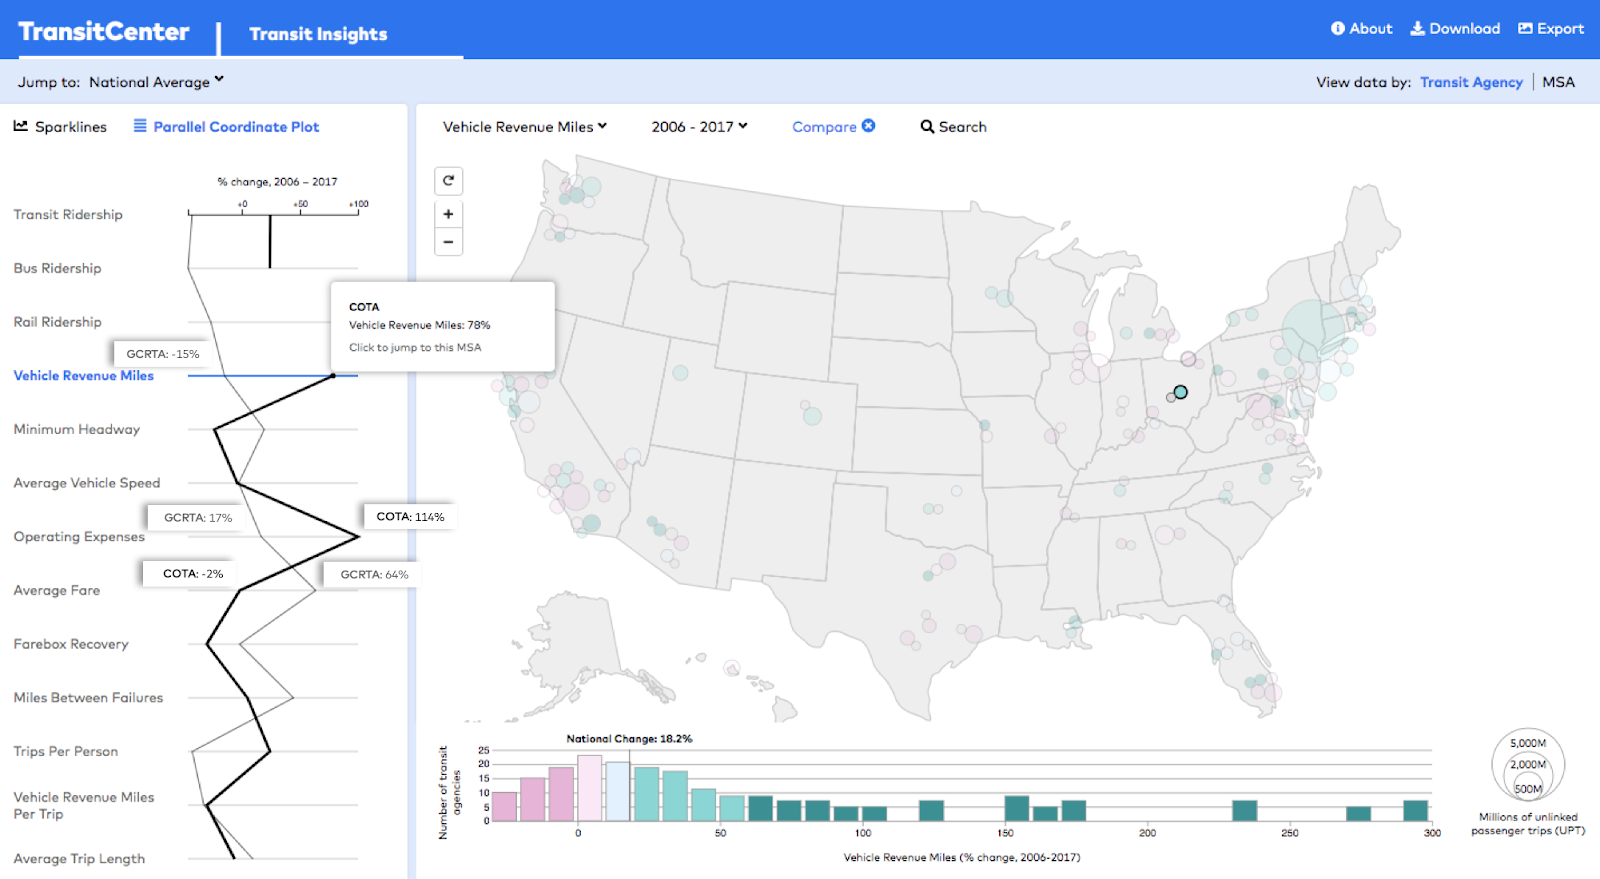
Selecting these two agencies on the Transit Insights map using the “Compare” feature, you can tell that regional population change isn’t the only cause of the divergent trends, since transit trips per capita also rose at COTA and fell at GCRTA.
Click to enlarge
Vehicle revenue miles are an indication of how much transit service an agency provides. As you’d suspect, people generally respond to service increases by riding transit more. From 2006 to 2017, COTA expanded its vehicle revenue miles nearly twofold. In Cleveland, GCRTA slashed service around the 2008 recession, and hasn’t fully restored it since.
Operating expenses — which have increased at most US agencies since 2006 — quantify how much agencies spend to run buses and trains. Generally, higher operating expenses enable more and better service. COTA has doubled its spending on operations, while GCRTA’s expenses grew only slightly after adjusting for inflation.
Raising fares, meanwhile, exerts downward pressure on transit ridership, particularly over the long term. Since 2006, GCRTA has approved several fare hikes, pushing up the average price riders pay per trip 65%. But for riders in Columbus, fares have remained largely unchanged.
Click to enlarge
Transit is most effective when it runs frequently in high-density areas. Columbus has densified in neighborhoods within walking distance of COTA’s expansive frequent bus network. But in Cleveland, job and population density decreased along much of GCRTA’s frequent network (which is far more limited than COTA’s).
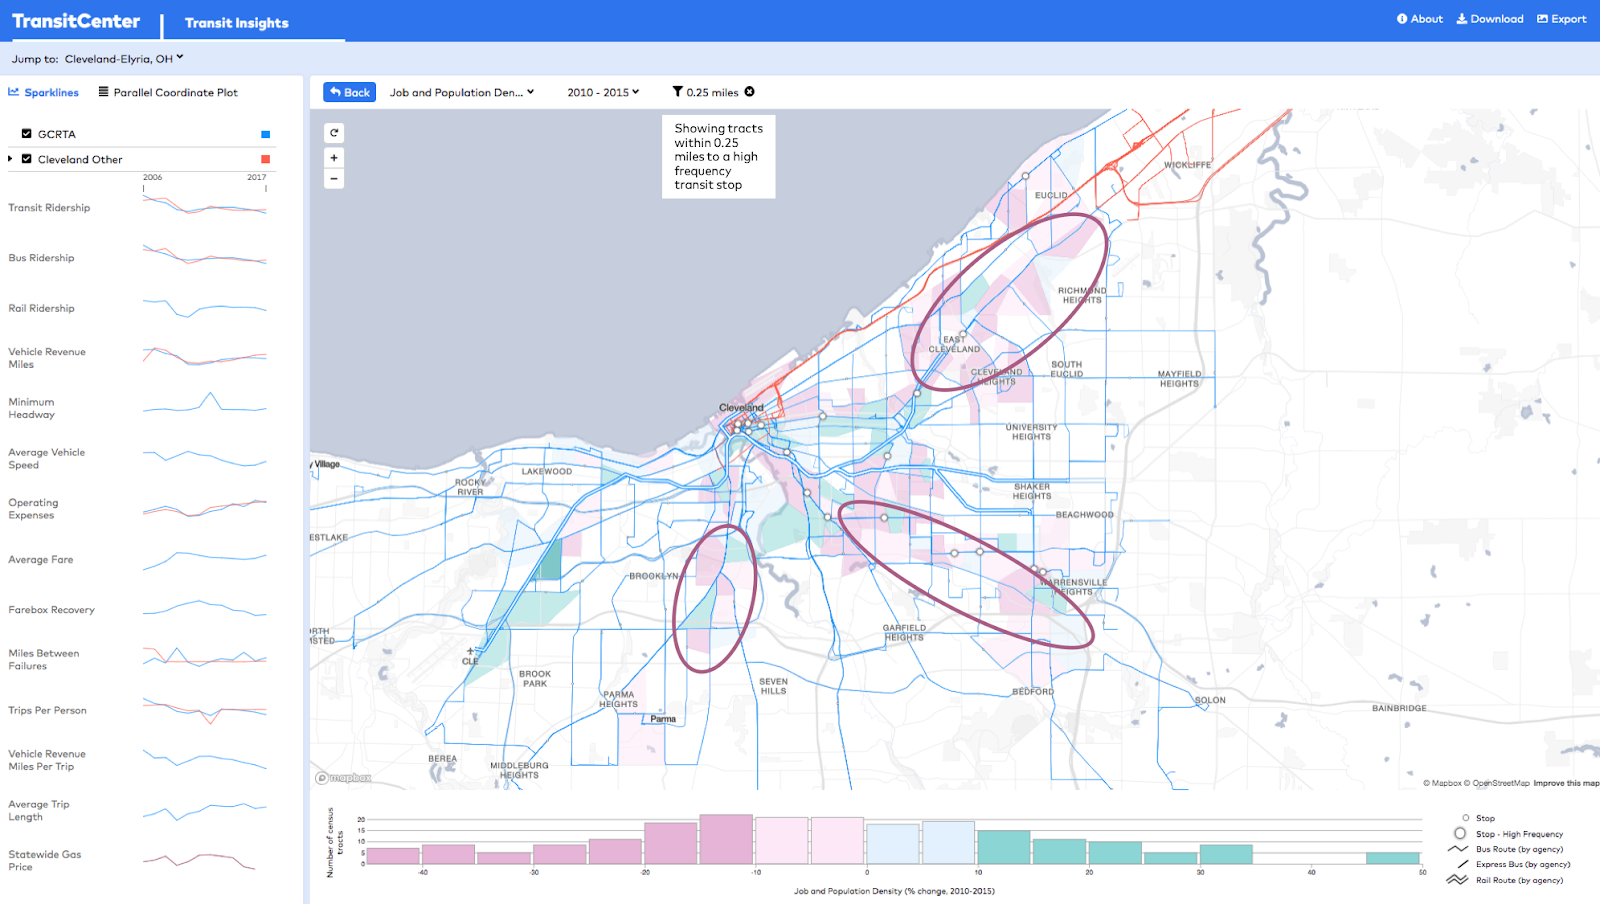
Click to enlarge
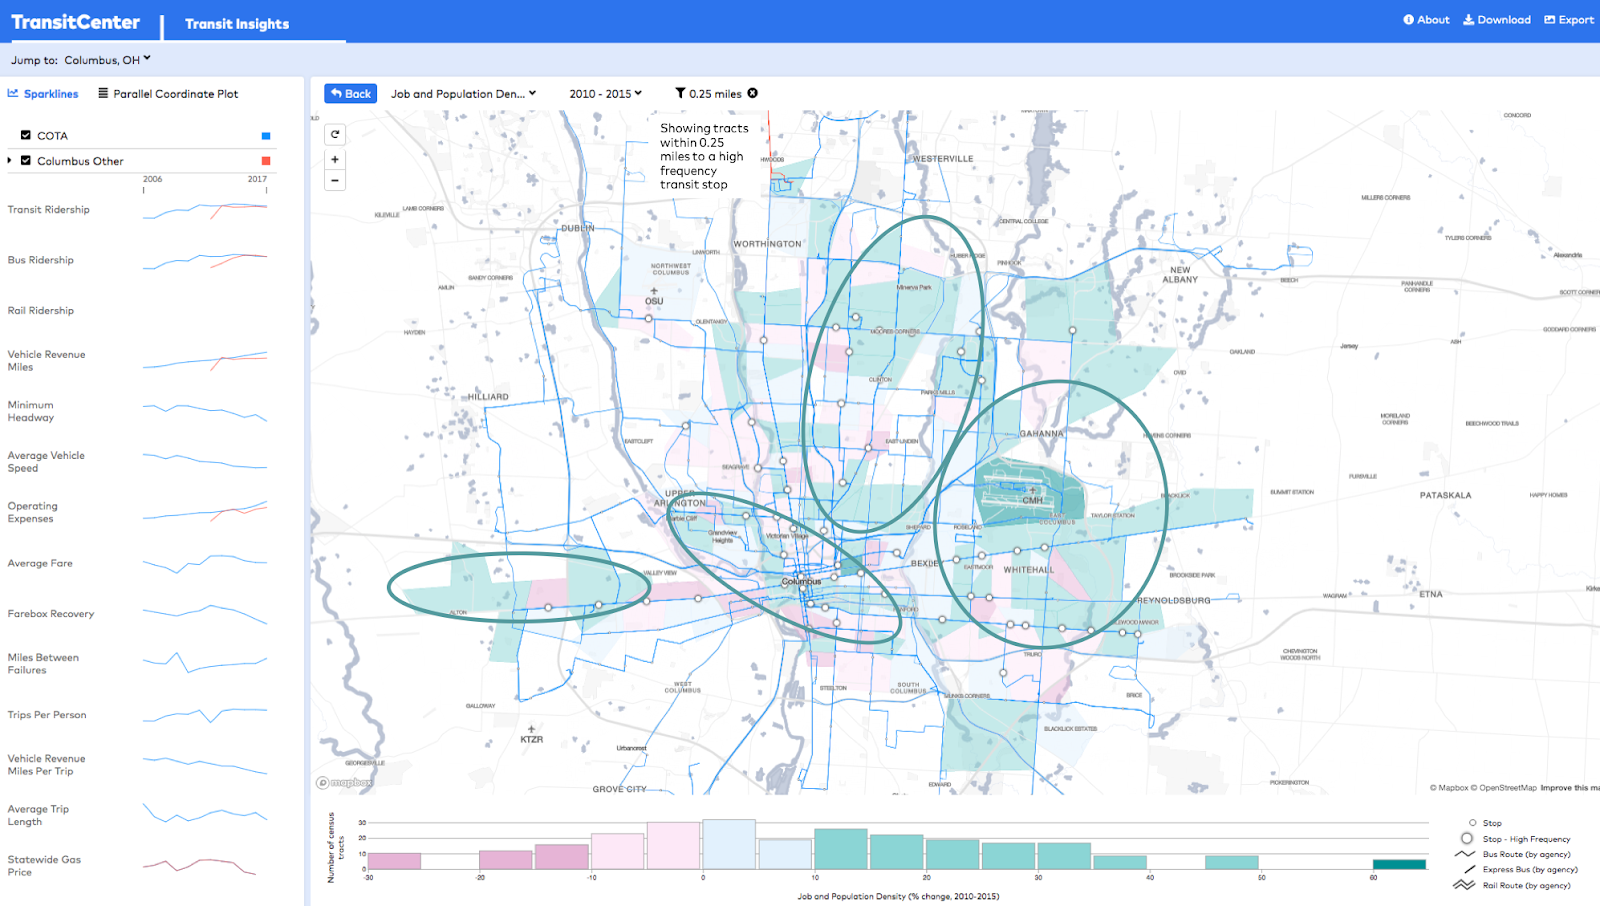
Click to enlarge
The tale of these two Ohio cities is just one example of the findings Transit Insights can unearth. Advocates, agency practitioners, journalists, and others can use it to measure, compare, and evaluate transit ridership trends in any major American metropolitan region.
Other queries of Transit Insights reveal that:
- From 2012 to 2017, transit ridership increased in just a quarter of the country’s largest urban areas. Population magnets Seattle and Phoenix experienced the fastest transit ridership growth.
- Only a few transit agencies have increased bus ridership since 2012 — most prominently, King County Metro and Houston Metro, which substantially altered service patterns with bus network redesigns.
- Transit speeds have slowed down at many agencies as street congestion worsens. One exception is LA Metro, which expanded light rail service in 2010.
- Ridership loss notwithstanding, in 2017 New York City Transit provided an average of 400 trips to each person living in its service area — over 150 more rides per capita than the next agency, San Francisco MTA.
Transit Insights draws on standardized data from the FTA’s National Transit Database, U.S. Census Bureau, and Transit.Land. A spreadsheet of agency data and images from Insights are available via the “Download” and “Export” features.
We’re sharing Transit Insights as a public beta. We welcome your questions about how to use it, suggestions for improving the tool, and examples of real-world application of Transit Insights in your work. Send your feedback to [email protected] or tweet @TransitCenter
 On the Brink: Will WMATA’s Progress Be Erased by 2024?
The experience of being a WMATA rider has substantially improved over the last 18 months, thanks to changes the agency has made like adding off-peak service and simplifying fares. Things are about to get even better with the launch of all-door boarding later this fall, overnight bus service on some lines starting in December, and an ambitious plan to redesign the Metrobus network. But all of this could go away by July 1, 2024.
Read More Built to Win: Riders Alliance Campaign Secures Funding for More Frequent Subway Service
Thanks to Riders' Alliance successful #6MinuteService campaign, New York City subway riders will enjoy more frequent service on nights and weekends, starting this summer. In this post, we chronicle the group's winning strategies and tactics.
Read More