The National Transit Database provides annual ridership data for all the transit agencies operating in the US. It’s a tremendous resource for advocates who would like to see how their transit agency is performing. The ridership numbers in the NTD can vary somewhat from those reported locally by transit agencies, but basic trends should be consistent.
The 2016 ridership data was just released, so we created this video to help you figure out how to access and use the data:
Stay tuned for a follow-up post tomorrow where we’ll discuss how to interpret ridership trends and become more effective advocates!
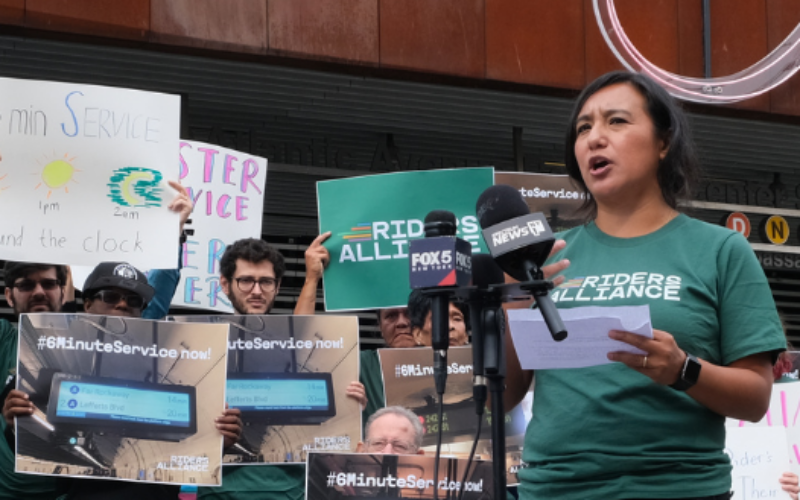 Built to Win: Riders Alliance Campaign Secures Funding for More Frequent Subway Service
Thanks to Riders' Alliance successful #6MinuteService campaign, New York City subway riders will enjoy more frequent service on nights and weekends, starting this summer. In this post, we chronicle the group's winning strategies and tactics.
Read More A Transit Revolution in Philadelphia?
The Southeastern Pennsylvania Transportation Authority (SEPTA) has been working throughout the pandemic on several system-wide planning initiatives that have the potential to transform transit service in and around the city of Philadelphia.
Read More