Editor’s note: this piece was originally published on 3/20 and was revised on 4/7 based on more detailed data.
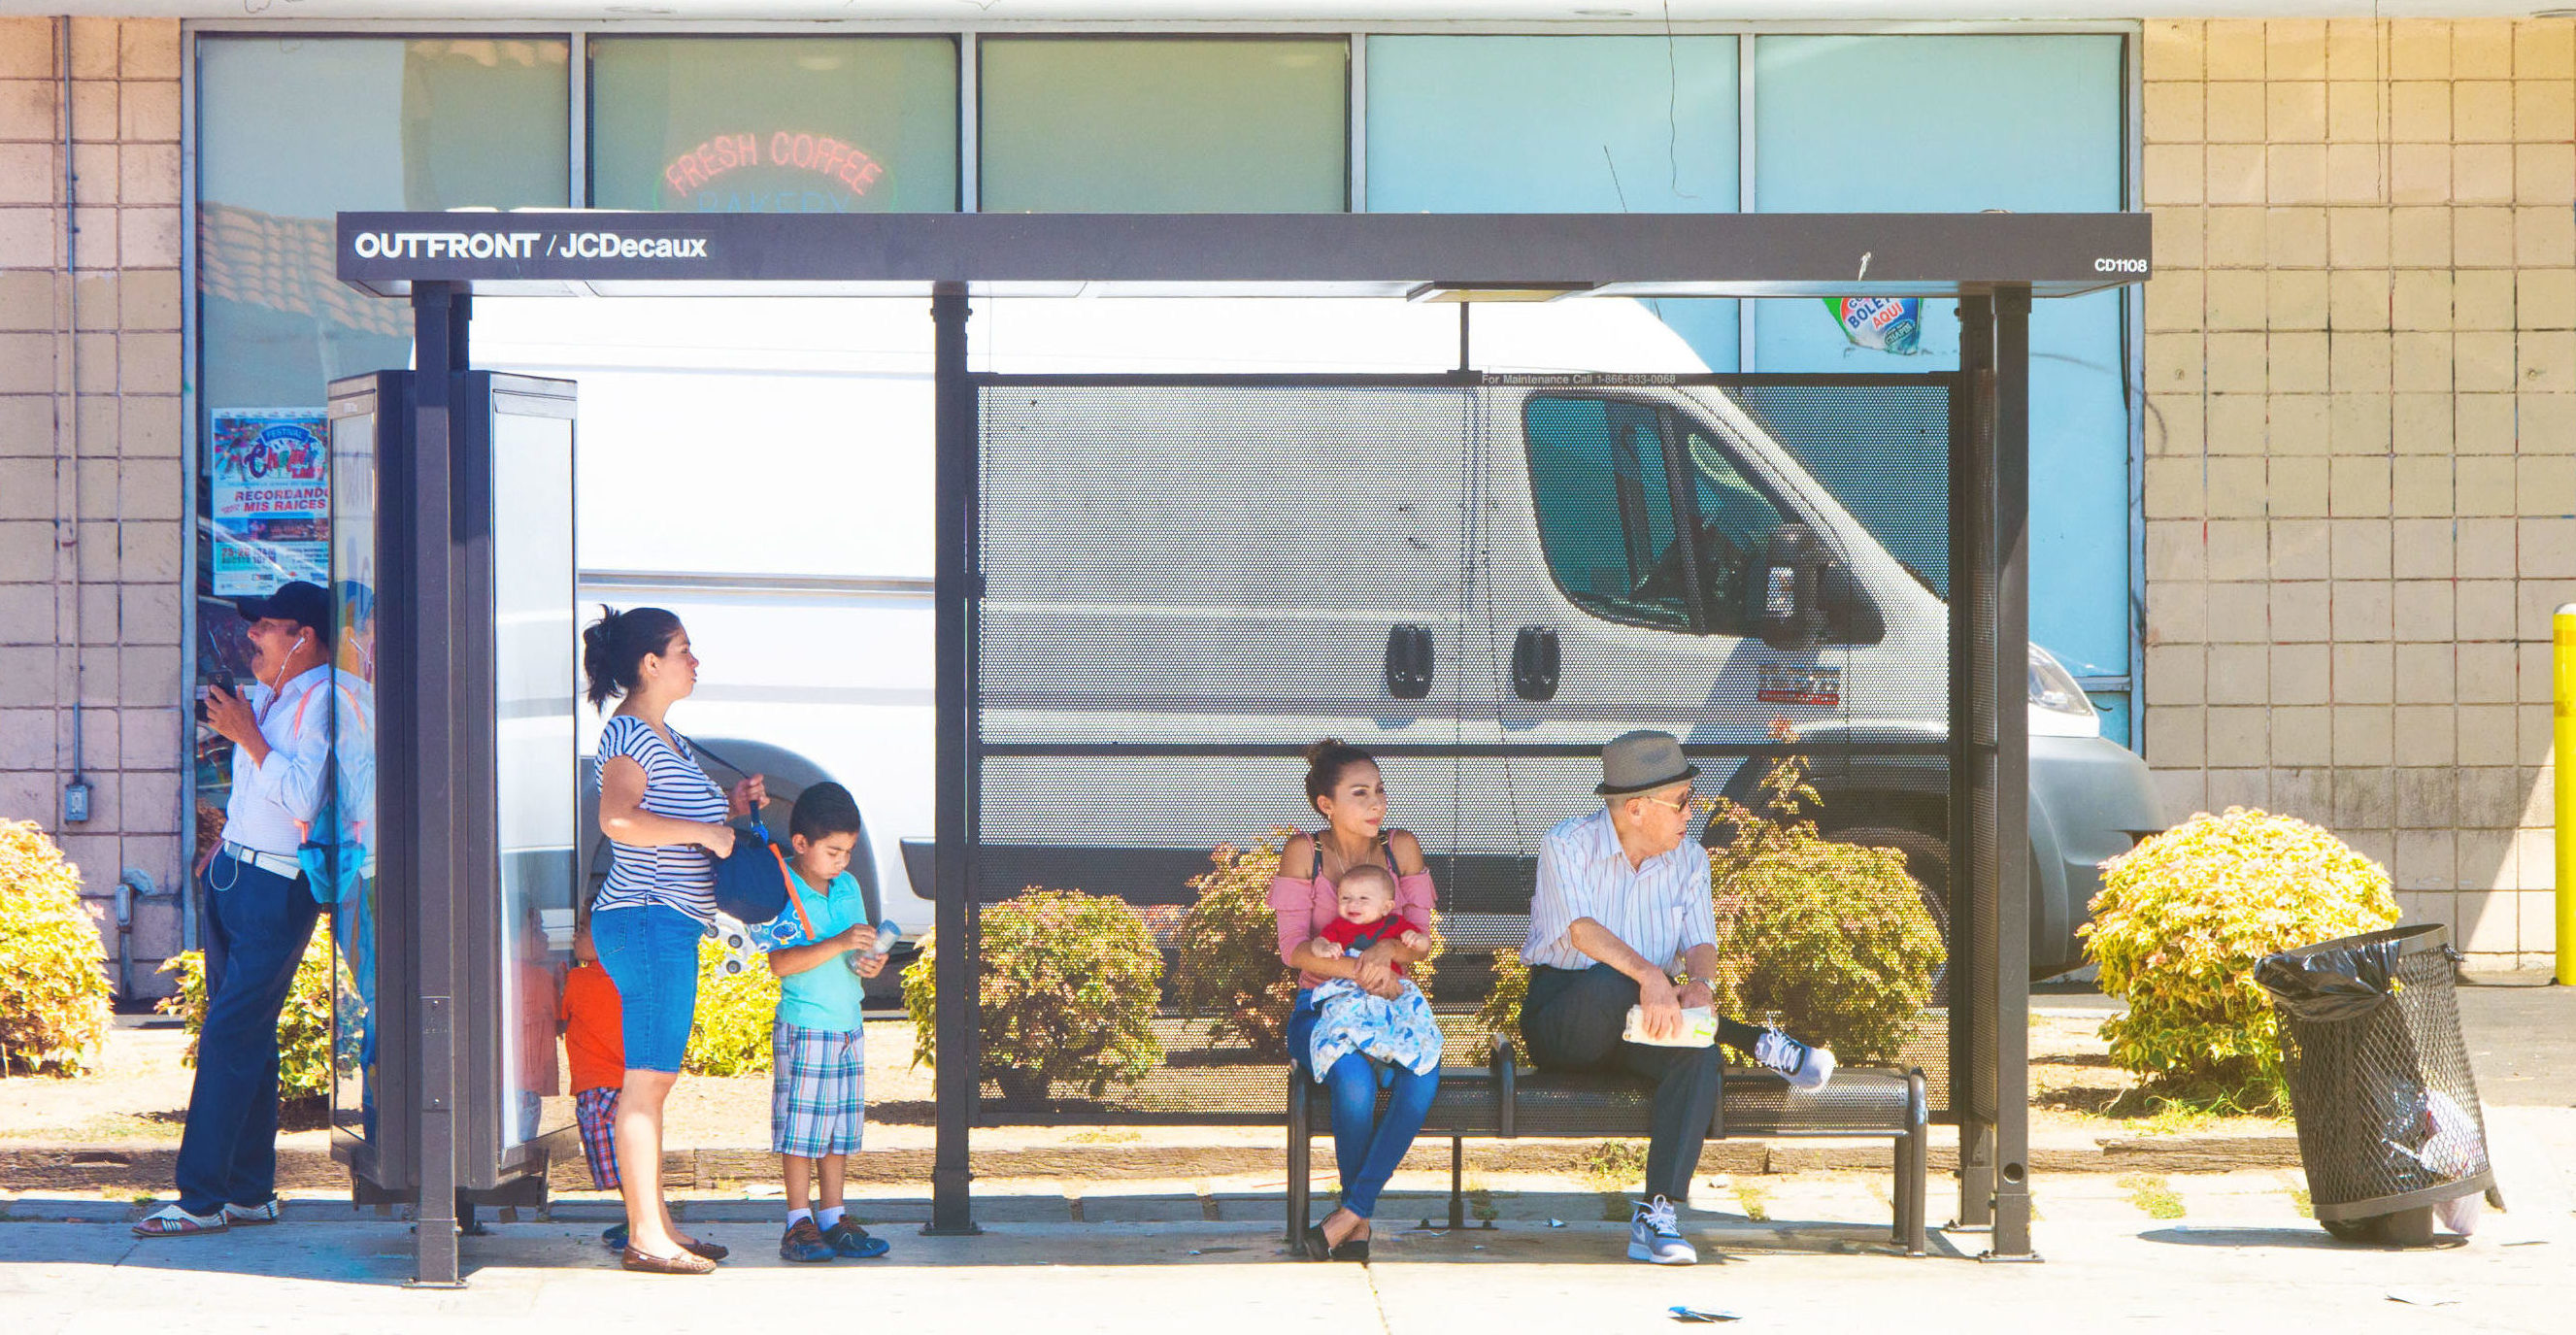
In recent weeks, it has become clear that public transportation is an integral part of the U.S. public health response to COVID-19, continuing to serve millions of trips: Health care workers going to and from their shifts; cleaners, warehouse staff, and food workers reporting to their jobs; utility employees; heads of household making trips to grocery stores and pharmacies.
Yet public transportation agencies across the country are under immense financial pressure due to:
- Sharp declines in fare revenue as large numbers of Americans shelter at home and reduce their travel.
- Reduced economic activity which has led to reductions in local and state sales, payroll, and other taxes that fund public transportation service–and which will put pressure on other local and state government support for transit. In addition, some transit agencies rely on taxes that must be renewed by voters in 2020; if those elections are postponed, agencies may face further shortfalls.
- Additional costs associated with confronting COVID-19, such as accelerated cleaning of vehicles, protective gear for employees, agencies opting to end fare collection in order to protect public health, and emergency staffing.
Public transit agencies cannot weather this crisis through cuts. In order to maintain proper social distancing, transit agencies must operate enough service so that riders are not subject to crowded vehicles.
We estimate that, depending on the extent of social distancing measures that are required over the next year, transit agencies could see an annual shortfall of $26-$40 billion. In this factsheet, we provide snapshots of current impacts on local agencies and provide two scenarios outlining the potential impact on transit agencies nationwide.
Transit Agencies Are Responding to the Crisis Under Financial Pressure
Transit agencies across the country are an essential part of the public health response to COVID-19. Ridership and finances have varied by place. Some examples:
- As of late March, New York City subway ridership is 87% lower than a year ago; NJ Transit ridership is down about 90 percent.
- As of March 23, Bay Area Rapid Transit ridership was 92% lower than on an average February 2020 weekday, and the agency has forecast 18-39% declines in sales tax revenue in its preliminary FY21 budget. The Bay Area has been under a “shelter in place” order.
- In a March 17 letter, Dallas Area Rapid Transit estimated a $60 million sales tax loss from March-September 2020; this would represent a 19% decline from projections in the agency’s FY20 business plan, The agency also estimated $600,000/week revenue loss and $100,000/week in increased costs.
- In Seattle, ridership on King County Metro buses has declined by about 60%. The agency previously estimated that per week, it is losing $1.3 million in fare revenue and $5 million in sales tax revenue. (This represents a 39% decline in sales tax revenue from a typical week in 2019, when King County Metro collected $12.8 million in sales tax revenue per week).
- Agencies around the country are modifying protocols to protect public health. Houston METRO announced it would increase service on key routes in order to reduce crowding. Several agencies have eliminated fares or moved to rear-door boarding in order to maintain social distancing.
What Might the Financial Impact on U.S. Transit Be?
Public transit will face intense financial pressure because of reductions in fare revenue, dedicated tax receipts and, potentially, local and state support. Below, we provide two illustrative estimates of what this may mean for agency finances if social distancing continues over the next 12 months, using 2018 transit funding figures from the National Transit Database.

Methodology
Fare revenue: We calculate two scenarios for transit fare revenue decline: 75 and 100 percent. Fare revenue will decline by more than ridership, because many systems have ended fare collection and/or fare enforcement to decrease social contact. The low-end estimate of 75 percent is in line with ridership declines that several major systems are currently reporting. The high-end estimate (no fare revenue) represents a scenario where transit agencies end fare collection in order to protect public health.
Agency taxes/fees and local sales tax: We calculate a 20 percent decline in agency-levied taxes and fees and local sales taxes in our low-end scenario and a 50 percent decline in the high-end scenario. These are based on projections from a mix of transit agencies as described above.
Tolls: Fitch Ratings forecasts a 60-75 percent reduction in tolled traffic in Q2 2020 and a 27-34% annual decline in tolled traffic for the 2020 calendar year assuming the pandemic eases by the end of Q2. We calculate a 30 percent decline in local tolls in our low-end scenario (close to Fitch’s calendar-year number) and a 60 percent decline in the high-end scenario (close to Fitch’s Q2 number, representing a scenario where severe restrictions on travel continue throughout the year).
State dedicated transportation funds: We estimate a 30 percent decline in state dedicated transportation fund revenue in our low-end scenario and a 60 percent decline in our high-end scenario. The composition of dedicated transportation funds vary by state, but tend to include fuel taxes, sales taxes, tolls, and vehicle fees – funding sources which are seeing substantial declines due to restrictions on travel. The North Carolina DOT predicts its fuel and car sales tax revenue will decline by over a third. For the week of March 27, INRIX has measured a 41% decline in vehicle travel nationally (compared to a week in February) and 50-62% declines in certain metro areas.
(Note that the NTD separates state funding into three categories: dedicated transportation funds, state general funds, and state funds received by NTD “reduced reporters” who do not need to disaggregate funding.)
Other local and state support: To calculate the estimated change in other local and state government support for transit, we start by examining the impacts of the “great recession” of 2007-09, which put substantial strain on local and state budgets. During the worst quarter of the recession (Q2 2009), local and state government receipts fell by 9.9% year-over-year, not including federal grants in aid.
However, the economic impact of COVID-19 on the U.S. will be significantly worse; weekly unemployment claims in many states are already twice as high as they were in any week during the 2007-09 recession. Therefore, at the low end of our estimate, we assume that local and state support, not including local sales tax, declines by 19.8% (twice as large as declines seen during the 2007-09 recession). At the high end, we assume that local and state support, not including local sales tax, declines by 29.7% (three times as large as declines seen during the “great recession”). We assume identical percentage declines in non-fare agency generated revenue (advertising, concessions, etc.) and no change in federal support.
COVID-19 costs: Finally, the American Public Transportation Association has estimated that transit agencies face $1.75 billion in direct costs related to COVID-19 for the six months of March-September 2020. In the low-end scenario, we double this to $3.5 billion to extrapolate to an annual figure, and add $350 million which is APTA’s estimate for costs associated with the restart of normal operations. For the high-end scenario, we increase the figure by 20% to represent contingencies.
 New TransitCenter Report: To Solve Workforce Challenges Once and For All, Transit Agencies Must Put People First
TransitCenter’s new report, “People First” examines the current challenges facing public sector human resources that limit hiring and retention, and outlines potential solutions to rethink this critical agency function.
Read More A Transit Revolution in Philadelphia?
The Southeastern Pennsylvania Transportation Authority (SEPTA) has been working throughout the pandemic on several system-wide planning initiatives that have the potential to transform transit service in and around the city of Philadelphia.
Read More