
Photo: CTA via Flickr
The $25 billion for public transportation included in the federal CARES Act is beginning to make its way around the country, supplying much-needed relief for transit agencies providing essential mobility during the COVID-19 emergency.
But a TransitCenter analysis of how this funding is distributed shows that, while it may be sufficient for most smaller public transportation agencies, it will provide just months of financial breathing room for agencies in the large metro regions where most transit riders live.
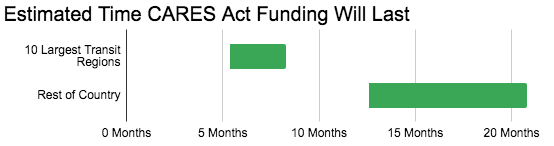
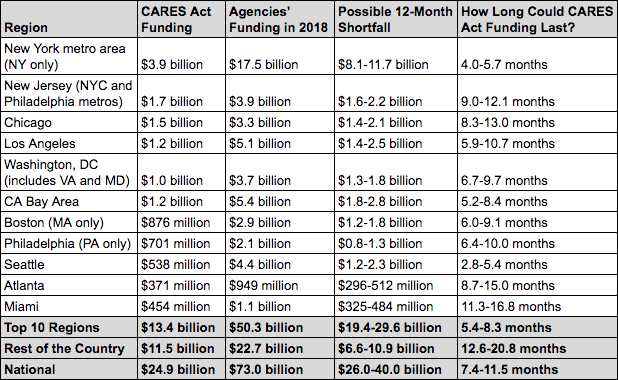
For the ten U.S. regions with the most transit ridership, we estimate that CARES Act funds will cover agency shortfalls for an average of 5.4 to 8.3 months. For agencies in the rest of the country, CARES Act transit funds will last 12.6 to 20.8 months, on average. (Note that these are averages, and some agencies in smaller transit regions will be in jeopardy as soon as the larger regions.)
Our previously published analysis of COVID-19’s effect on transit budgets estimated that, over the course of a year, agencies would face financial shortfalls between $26 and $40 billion. These shortfalls won’t be distributed evenly, because revenue sources vary between agencies.
Our model assumes precipitous declines in fare revenue, significant declines in dedicated taxes due to an economic downturn, and more moderate declines in local and state support. In other words, agencies more reliant on fares and dedicated taxes will face steeper financial shortfalls. Larger transit agencies tend to fall into this category:
For the ten U.S. regions with the most transit ridership, we estimate that CARES Act funds will cover agency shortfalls for an average of 5.4 to 8.3 months. For agencies in the rest of the country, CARES Act transit funds will last 12.6 to 20.8 months, on average.
Seattle and New York City, two regions that have borne the early brunt of COVID-19, are also the most likely to quickly exhaust available CARES Act funding. In those regions, funding may last only three or four months. Compounding matters for New York’s MTA is that the CARES Act also dramatically shortchanged the agency relative to its ridership.
CARES Act funding may last only half a year in the Bay Area, Los Angeles, metropolitan Boston, greater Washington, D.C., and Philadelphia.
Outside of the largest transit regions, meanwhile, CARES Act funding will likely last longer — covering at least a year’s worth of needs, on average.
This doesn’t mean every small or moderate-sized city is in the clear, however. For example, transit agencies in Columbus, Ohio, and Kansas City, Missouri, receive virtually no state support and instead rely heavily on sales tax revenue. Because of this, TransitCenter’s model also predicts that they may have just six months of flexibility from the CARES Act.
CARES Act funding was distributed through the federal transportation formula programs, which are normally used to fund capital projects like buying buses and repairing rail stations. They were a ready tool in this emergency, but a flawed one. “Formula” programs distribute funding according to equations based on factors like how much bus service an agency operated last year, regional population, and population density.
Those factors don’t include how hard a region has been hit by COVID-19, or how tenuous its funding sources are. The result: Some of the hardest-hit transit agencies get the least help, relative to their need.
Notes
Federal transit funding from the CARES Act is primarily distributed based on Census-defined urbanized areas (UZAs). Some of the “major transit regions” defined above include more than one UZA; we chose these UZAs based on transit agency service areas, and in some cases the jurisdiction of agencies that are “designated recipients” of federal transit funds and have responsibility for distributing them to transit operators.
Totals above are for transit agencies serving UZAs in regions defined as followed:
- New York metropolitan area (NY only): The New York state portions of the New York-Newark, NY-NJ-CT and Poughkeepsie-Newburgh, NY-NJ UZAs.
- New Jersey: The Trenton, NJ UZA and the New Jersey portions of the New York-Newark, NY-NJ-CT and Philadelphia, PA-NJ-DE-MD UZAs.
- Chicago: The Illinois portions of the Chicago, IL-IN and Round Lake Beach-McHenry-Grayslake, IL-WI UZAs. (The Round Lake UZA is served by Metra and Pace.)
- Los Angeles region: The Los Angeles-Long Beach-Anaheim, CA UZA.
- Washington, DC region: The Washington, DC-VA-MD UZA. (We chose not to divide this region by state because doing so would inaccurately reflect the agreement between Virginia, Maryland, and the District of Columbia to jointly fund WMATA.)
- Bay Area: All UZAs over 200,000 people whose designated recipient is the Metropolitan Transportation Commission: San Francisco-Oakland, CA; San Jose, CA; Antioch, CA; Concord, CA; and Santa Rosa, CA.
- Boston: The Massachusetts portion of the Boston, MA-NH-RI UZA.
- Philadelphia: The Pennsylvania portion of the Philadelphia, PA-NJ-DE-MD UZA.
- Seattle: The UZAs whose designated recipient is the Puget Sound Regional Council: Seattle, WA; Bremerton, WA; and Marysville, WA.
- Atlanta: The Atlanta, GA UZA.
- Miami: The Miami, FL UZA.
Agencies’ funding in 2018 is operating and capital, and from the National Transit Database.
Projected shortfalls are from TransitCenter’s April 7 analysis. Low-end estimate assumes 75% decline in fares; 20% decline in agency-levied taxes and fees and local sales tax; 30% decline in tolls and state dedicated transportation fund revenue; 19.8% decline in non-fare directly generated agency revenue and local and state support not including local sales tax. High-end estimate assumes 100% decline in fares; 50% decline in agency-levied taxes and fees and local sales tax; 50% decline in tolls and state dedicated transportation fund revenue; 29.7% decline in non-fare directly generated agency revenue and local and state support not including local sales tax.
 On the Brink: Will WMATA’s Progress Be Erased by 2024?
The experience of being a WMATA rider has substantially improved over the last 18 months, thanks to changes the agency has made like adding off-peak service and simplifying fares. Things are about to get even better with the launch of all-door boarding later this fall, overnight bus service on some lines starting in December, and an ambitious plan to redesign the Metrobus network. But all of this could go away by July 1, 2024.
Read More To Achieve Justice and Climate Outcomes, Fund These Transit Capital Projects
Transit advocates, organizers, and riders are calling on local and state agencies along with the USDOT to advance projects designed to improve the mobility of Black and Brown individuals at a time when there is unprecedented funding and an equitable framework to transform transportation infrastructure, support the climate, and right historic injustices.
Read More