
Every thirty seconds a stream of GPS data is broadcasted from thousands of local buses operating in New York City, making it possible to illuminate a vast amount of information about the performance of the Metropolitan Transportation Authority’s (MTA) bus network.

CUSP students show their newly developed BusViz tool to presentation attendees, including MTA staff
Big data wasn’t needed to know that the city’s local bus system could be improved. Previous research has validated what millions of New Yorkers already knew: that NYC has some of the slowest average bus speeds in the country and that outer borough residents have some of the nation’s longest commutes. Inadequate service has broad impacts on the city’s overall economic and social well-being, and disproportionately impacts low income New Yorkers (see research from the NYU Rudin Center for Transportation, Pratt Center for Community Development, and Regional Plan Association). The MTA’s real time data feed is significant because it provides an opportunity for civic engagement on the challenge of bringing bus performance to a standard befitting NYC. Two recent analyses highlight how powerful such engagement could be, raising important questions about current bus service and suggesting starting points to realize needed changes.
Software developer Nathan Johnson began archiving and analyzing Bus Time data (with support from BetaNYC) in response to a call from City Council Member Ben Kallos to evaluate bus service in his district. Johnson initially assessed on-time performance and more recently calculated wait time probabilities and schedule fulfillment for Manhattan buses.
One bus line stood out in his recent analysis: the M35, which consistently had poor on-time performance, longer than scheduled waits, and a high percentage of scheduled buses that simply failed to appear. In July, for example, nearly 30% of scheduled buses appeared to be missing. Weekday afternoons looked particularly bad, with a truancy rate near 50%. Wondering if the data was accurate, Nathan visited the route on a Thursday in June to observe the M35 first-hand and confirmed what the data had suggested: scheduled buses were not showing up.
The M35 is a key transit link to homeless shelters, substance abuse rehabilitation clinics, and a psychiatric care facility on Ward’s Island. Nathan visited the route again on a Sunday afternoon, when data had indicated better service. His visit supported this analysis, and he observed different riders than he had on his weekday visit — many of whom were carrying tennis rackets and heading for athletic facilities served by the route. Can it be a coincidence, he wondered, that this line with the poorest reliability serves what may well be the most disenfranchised residents of New York? Whether due to staffing issues, equipment shortages, or other reasons, insufficient deployment of buses to this line is a serious ongoing issue – noticeably more so than for other routes. This disparity raises the question of what policies and practices govern service priorities. What is an adequate standard of bus service provision, and how do we ensure accountability to such standards? How do we know that all residents are receiving good service, regardless of their socio-economic status or race – and if they’re not, how do we rectify those inequities?
The questions concerning service standards and accountability raised by the M35 example are just one demonstration of this data’s potential to prompt questions regarding what bus service in NYC ought to be. Also working with real time data made available by the MTA, a group of graduate students and their advisor at NYU’s Center for Urban Science and Progress (CUSP) are working on an interactive website that visualizes system-wide data on metrics like bus speed, reliability, and bunching. This will be a powerful resource once publicly available, allowing people who are interested in improved bus service to examine what’s occurring within given geographic areas, along particular routes, and at individual bus stops. We’ll post more about that site when it’s up and running.
Given the broad benefits a high-performing bus network would bring to the city, it’s time for serious attention to system-wide change. Select Bus Service (SBS) has improved speeds and ridership in seven corridors with semi-exclusive lanes and off-vehicle fare payment. MTA Bus Time data empowers us to take stock of the system as a whole and identify priority improvements that will have a wide impact on bus routes and customers (and it is to MTA’s credit that they make data available to the public). We can start by reassessing our standards for this bus system and setting performance outcomes accordingly. What are acceptable wait times on high-demand routes, for example? What changes would be needed to achieve these numbers? Yes, realizing wide-scale change to NYC’s bus system will be challenging, but the civic sector is the only place where the pressure to embark on such change is likely to originate.
In upcoming posts, we’ll consider some of the possibilities for using real time data to transform NYC’s buses. In the meantime, what standards do you think should be established for NYC’s buses? What would you like to see done with the real time data?
[CORRECTION: this post can be read to imply that weekend service is substantially worse than weekday service. Comparing weekday to weekend schedule fulfillment through 2015 thus far, however, the difference is less stark, with Bus Time data showing weekend fulfillment at 73% compared to 70% on weekdays (the difference does appear to vary substantially from month to month). These calculations also do not correct for some errors that the MTA is able to take into account in their own internal calculations, using data not currently available to the public]
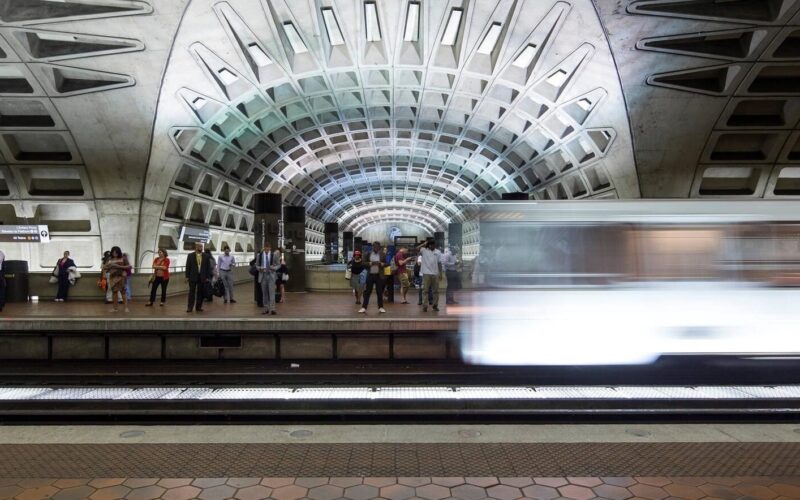 On the Brink: Will WMATA’s Progress Be Erased by 2024?
The experience of being a WMATA rider has substantially improved over the last 18 months, thanks to changes the agency has made like adding off-peak service and simplifying fares. Things are about to get even better with the launch of all-door boarding later this fall, overnight bus service on some lines starting in December, and an ambitious plan to redesign the Metrobus network. But all of this could go away by July 1, 2024.
Read More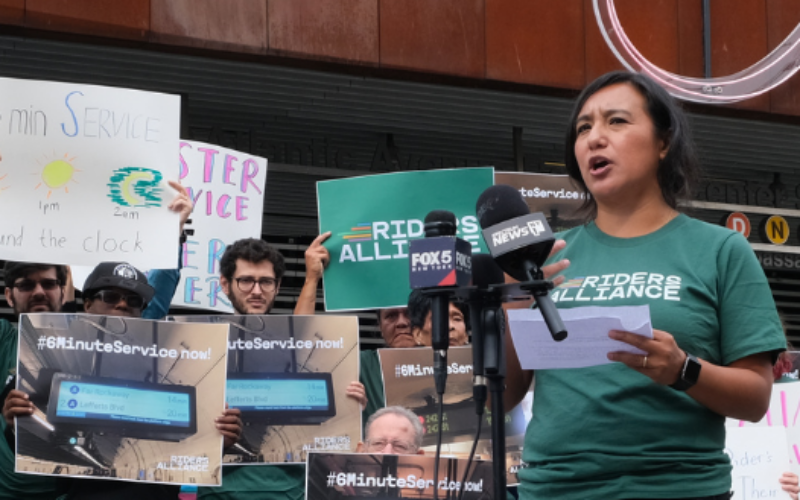 Built to Win: Riders Alliance Campaign Secures Funding for More Frequent Subway Service
Thanks to Riders' Alliance successful #6MinuteService campaign, New York City subway riders will enjoy more frequent service on nights and weekends, starting this summer. In this post, we chronicle the group's winning strategies and tactics.
Read More