At its best, public transit provides affordable and convenient connections to jobs, goods and services, medical care, and other essentials of daily life. But pervasive racism and discrimination in American land use, transportation, and transit planning have limited the reach of transit and created wide gaps in transit access, inhibiting transit’s ability to serve as a “ladder of opportunity.”
Until recently, measuring these gaps and how they manifest across race, income, and other characteristics was beyond the computational means of transit agencies. But advances in how agencies report service information have made it feasible to quantify these access-to-opportunity metrics.
TransitCenter’s research team harnessed this information to develop the Transit Equity Dashboard, a first-of-its-kind tool which measures how well transit networks in six U.S. cities connect people who’ve been marginalized by segregation and discrimination to the jobs, services, and amenities they need to thrive. Using data from transit agencies and the U.S. Census, the dashboard illuminates disparities in transit access.
This dashboard aims to help transit practitioners, policymakers, and advocates make more informed and equitable decisions by providing clear metrics about access disparities. By adopting these metrics, we can assess whether changes to transit networks close or widen these gaps.
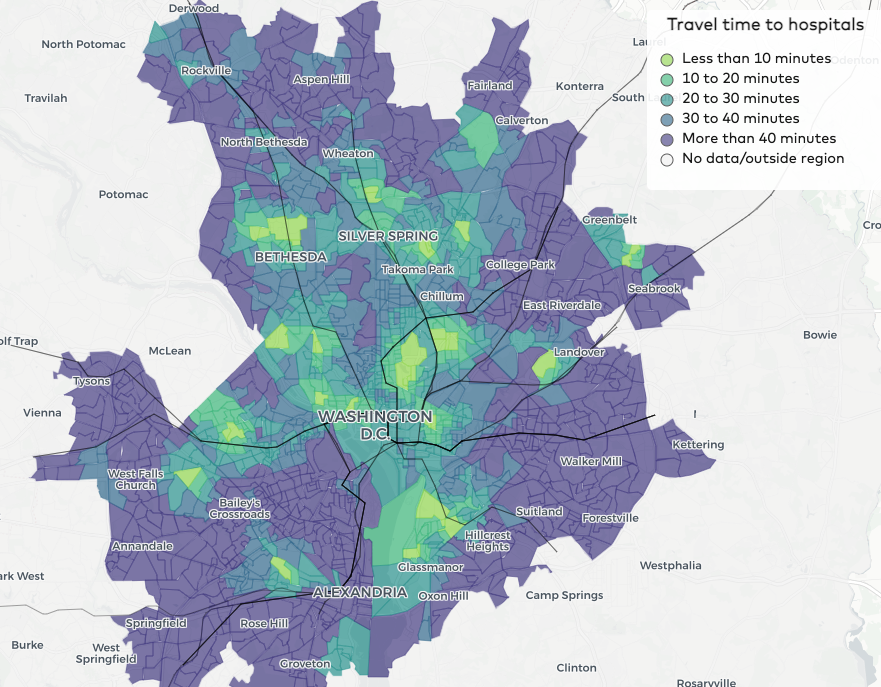
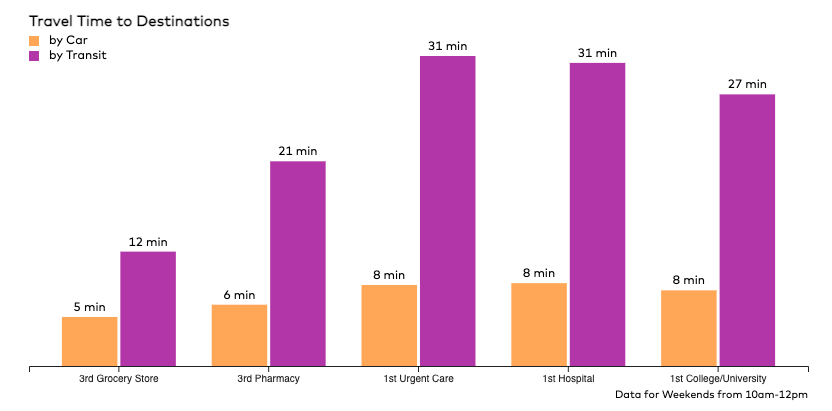
The maps and charts in the dashboard provide an overview of the state of transit equity in New York, Los Angeles, Chicago, Philadelphia, Washington DC, and the San Francisco Bay Area. Within each region, the dashboard looks at disparities in access to frequent transit, the number of jobs people can reach within a limited timeframe or budget, travel times to hospitals and grocery stores, and other metrics.
High-level takeaways include:
In every region, people of color are more likely to commute by transit than white people are, but far more jobs are accessible by driving than by transit. In the Chicago region, for example, the average resident can reach seven times as many jobs by car than by transit.
On a weekend morning in Los Angeles, it takes nearly four times longer to reach the nearest hospital or urgent care facility using transit than using a car.
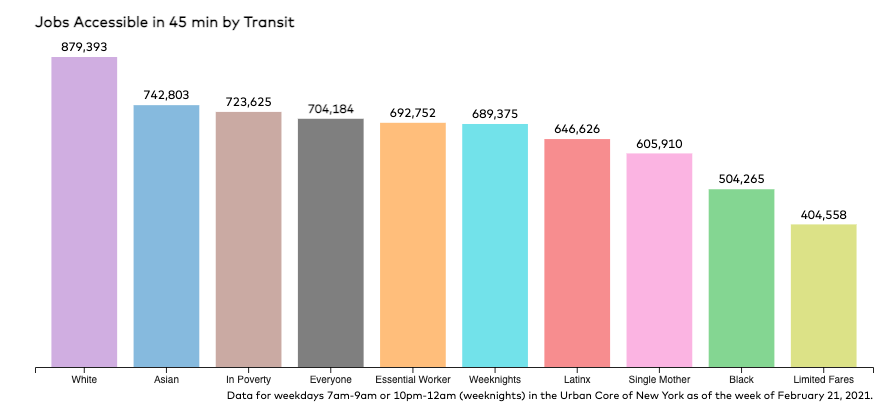
In the New York region, the average Black resident can access about 45% fewer jobs in a 45-minute transit trip than the average white resident.
In the Bay Area, job access for Latinx residents shrinks by more than a third if the rider can’t afford fares on “premium” transit service like commuter rail.
For a fuller picture, check out the individual city pages of the dashboard, or our fact sheet snapshots for New York, Los Angeles, Chicago, Philadelphia, Washington DC, and the San Francisco Bay Area.
The responsibility for closing these gaps extends beyond transit agencies – access gaps are the legacy of systemic racism and discrimination in American life, including land use, transportation, and transit planning. Achieving more equitable transit requires changes to both the broad sweep of transportation and land use in addition to the specifics of transit operations and fare policy.
Our advocacy partners in many of the cities analyzed by the dashboard have proposed reforms to remediate the racial and economic divides in transit access, including:
- City DOTs implementing street design changes to speed up bus service
- Transit agencies making commuter rail more affordable, and offering more service throughout the day
- Local governments working with transit agencies to develop areas around rail stations with affordable housing
The methodology underpinning the dashboard can be replicated by transportation and planning agencies in any region. Transit agencies and local governments should develop similar tools to measure inequities, adopt new performance targets, and assess progress toward equitable transit access.
In July, we’ll be offering a webinar tutorial for using the dashboard – stay tuned for updates! In the meantime, if you have questions or comments about the dashboard, please get in touch with us at [email protected].
The Transit Equity Dashboard was developed by TransitCenter Research Director Steven Higashide and Senior Research Associate Mary Buchanan in conjunction with Sustainable Systems Research, SF2 Enterprises, and Klumpentown Consulting — a team that includes leading transportation equity researchers from the University of Texas at Austin, the University of Vermont, and the University of Toronto.
 On the Brink: Will WMATA’s Progress Be Erased by 2024?
The experience of being a WMATA rider has substantially improved over the last 18 months, thanks to changes the agency has made like adding off-peak service and simplifying fares. Things are about to get even better with the launch of all-door boarding later this fall, overnight bus service on some lines starting in December, and an ambitious plan to redesign the Metrobus network. But all of this could go away by July 1, 2024.
Read More To Achieve Justice and Climate Outcomes, Fund These Transit Capital Projects
Transit advocates, organizers, and riders are calling on local and state agencies along with the USDOT to advance projects designed to improve the mobility of Black and Brown individuals at a time when there is unprecedented funding and an equitable framework to transform transportation infrastructure, support the climate, and right historic injustices.
Read More