Executive Summary
Amid falling ridership in their transit systems, industry experts and US transit agencies have sought answers. They have put forth many explanations for declining transit use, with varying degrees of evidence and certainty. What’s clear is that agencies must understand local ridership decline to address it.
We used an online survey of respondents in seven regions, as well as focus groups in three regions, to explore the spectrum of factors influencing decisions to take transit. Respondents were asked to describe how they used transit and other modes now and two years ago.
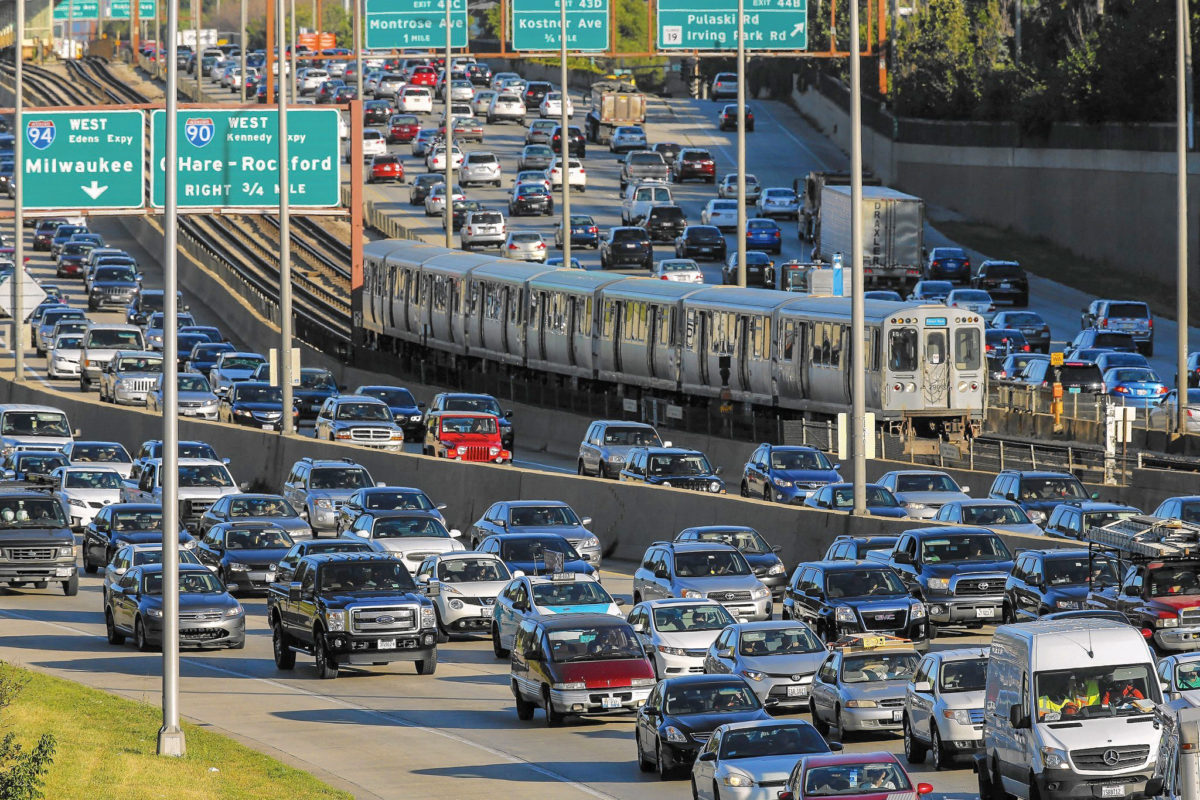
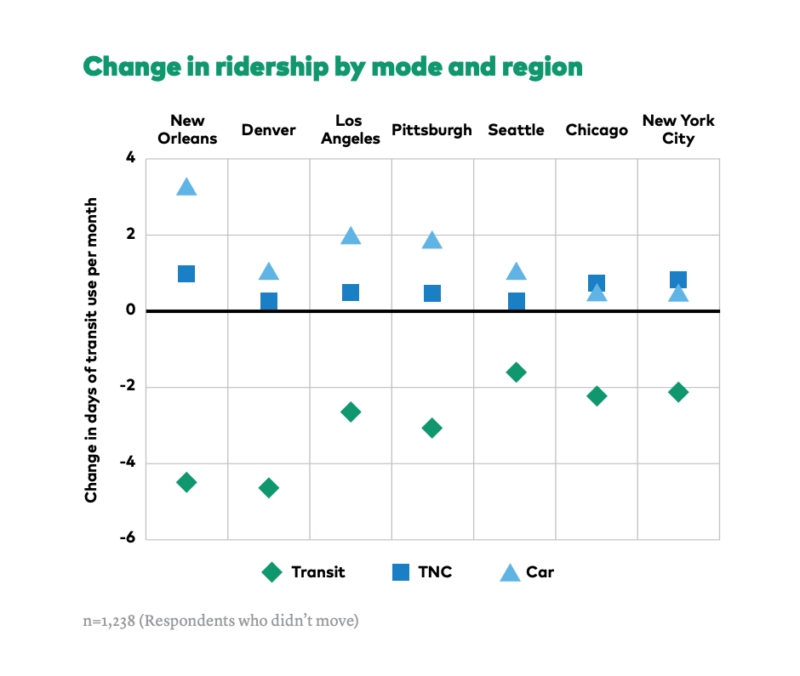
Overwhelmingly, survey respondents who abandon or substantially scale back their transit use replace those trips with increased private car use. Respondents who reported an increase in access to a private car over the past two years said their transit use had fallen by more than seven days per month.
The private car is transit’s strongest competitor, but transportation network companies (TNCs) like Uber and Lyft are nibbling away at some transit trips, especially in dense cities such as Boston, Chicago, New York City, San Francisco, Seattle, and Washington, DC.
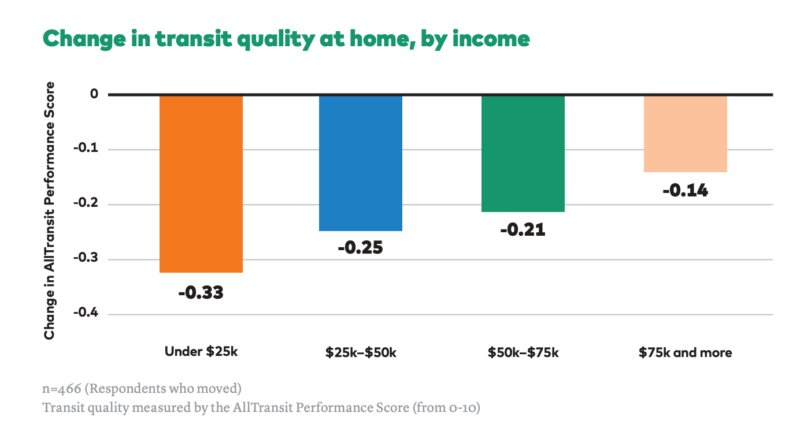
Moving has a large impact on transit use—and generally, low-income respondents are pushed farther from transit when they move, threatening their ability to use transit.
For urban transportation leaders, the most critical policy imperative is making opportunities accessible without a car. New transportation technologies, like TNCs, shared bikes and scooters, and autonomous vehicles dominate headlines about “the future of transportation.” But the most important transportation choice today’s mayors and agency leaders face is an old one: Do we build places where residents must use cars to get to most jobs, schools, and other destinations? Or, do we enable more people to meet their travel needs with public transit and a combination of other modes?
Press
Talking Headways:
A Streetsblog Podcast Episode 241 Who’s Riding Transit in 2019?
Trains: America’s transit challenge: Part I
Smart Cities Dive: Report: Transit ridership declining, but riders could be won back
CityLab: What’s the Perfect Price for Public Transportation?
Planetizen: Survey Examines the Changing Habits of the American Transit Rider
Route Fifty: Riders Aren’t Quitting Transit—Just Using It Less Often
All Transit Ridership is Local
The divergent fortunes of transit in different cities show that “all ridership is local,” rather than a microcosm of the national story.
Several factors affect transit ridership, all of which vary by region. These include the macroeconomic (e.g., changes in gas prices or employment), the technological (such as the introduction of TNCs and other competing and complementary modes), the demographic and geographic (e.g., an influx of young workers, an exodus of jobs to the suburbs, or how land and streets are developed), and the quality of transit service (like buses that come more often or rail service that is becoming less reliable). Mineta Transportation Institute researchers found this last factor—the quality of service––to be the strongest determinant of bus ridership.
Mineta Transportation Institute researchers found this last factor—the quality of service––to be the strongest determinant of bus ridership.
On systems with deferred maintenance issues (like WMATA in Washington, DC), unreliability and service outages may be driving passengers away. In fast-changing cities like Portland, displacement of low-income residents may make it difficult for them to use transit. Transportation network companies like Lyft and Uber may be pulling people from transit, particularly at times of day when transit does not run frequently and in places like San Francisco with relatively low car ownership. Amid economic growth and transit expansion, Sound Transit and King County Metro (both in the Seattle region) and Metro in Houston have increased their transit ridership since 2014.
Findings
- Taking Transit, But Less Often
- In the Transportation Marketplace, the Car is the Competition
- When Life Happens, Transit Use Responds
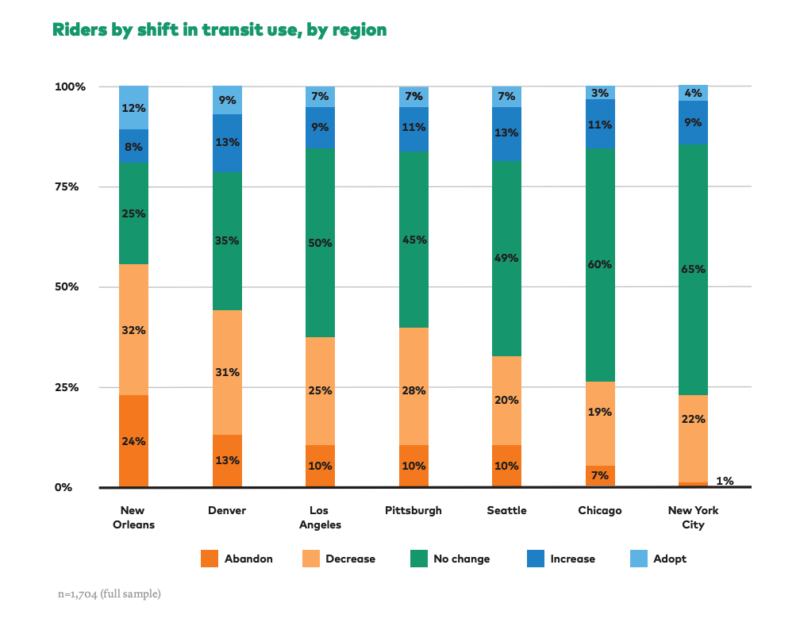
Transit riders are reducing their transit use. The data show that there are fewer riders who use transit multiple times per week. And on average, respondents—regardless of why they use transit—are using transit on fewer days per month. Riders who reduce—but still take some transit trips—drive the overall decline observed in the survey, rather than customers who abandon transit service altogether.
The sample shows that in strong-transit regions—New York City and Chicago—more riders had steady transit use (meaning they were in the same rider category in both periods) than in other regions. All-purpose riders are also most numerous in New York City and Chicago. This indicates that strong-transit regions are better able to support all-purpose riders and stable transit ridership than other regions. On the other hand, as many New Orleans respondents abandoned transit completely as maintained stable transit ridership over the two-year period.
Despite net declining transit ridership, there has not been a blanket rejection of transit. Decreaser riders who cut back on transit but haven’t abandoned it completely fueled the decline in ridership observed in the sample. Abandoners, who no longer ride transit at all, were responsible for just 25% of total ridership decline. This finding suggests that while transit does not meet riders’ needs as well as it did two years ago, riders still rely on transit for some trips. Also, transit agencies are enticing some current customers to ride more and attracting some new riders. Established transit users who increased their ridership are more numerous than adopters who started riding transit over the last two years.
An uptick in driving dominates changes in the transportation market, as car trips unambiguously replace trips on transit and other modes of travel. As buying a car gets easier in a car-friendly world and demanded trips increase and disperse geographically, more people are driving, and more often. At the same time, travelers are using transit and its complementary modes less—except for TNC travel.
Nationally, access to private cars has increased steadily since the Great Recession, as no-car households become rarer and households with at least two cars become more common. New-car sales and leased vehicles peaked in 2016, and used-car sales reached a new level in 2017. The total miles driven on US roads has increased each year since 2011, and Americans drove more miles than ever in 2018 (per capita, the number of miles driven has increased since 2014).
Cheap auto-loan financing has fueled greater access to private cars. Almost half of respondents received a loan for their recent car purchase, and of those, 56% said that getting a loan was easier than they had expected (less than 10% found it harder than expected).
The relationship between TNC use and transit ridership is positive but complicated. Transit riders are more likely than others to use TNCs, and increasing TNC use is associated with higher transit ridership. Focus group participants said that they take TNCs for “first-mile/last-mile” connections to transit or use TNCs to get to destinations only reachable by car. However, it is unclear how many TNC trips are in addition to regular transit use and how many are to replace regular transit use.
Respondents who reported a big event in their personal lives over the two years shifted their transit use more than average. Moving to a new home and relocating for work were associated with large shifts in transit travel. Respondents whose incomes increased also reported large shifts in ridership.
The degree to which respondents altered their transit use following major life changes reflects regional transit qualities. Respondents from New York City and Chicago shifted their transit use much less following a big event, compared even to riders who didn’t undergo a big change in other regions. This suggests that in strong-transit regions, transit use is more resilient to personal change. Put another way, in these regions transit is indispensable or broadly available, regardless of personal circumstances.
The survey found that people who use transit the most have modest annual household incomes ($25,000–$75,000) and live in areas with good service (AllTransit score of 8.0 or more). But housing costs in transit-accessible neighborhoods are higher than in similar areas with worse access, and where transit expands, costs rise precipitously—conditions that low-income residents are less able to afford. Among respondents who moved, respondents with household incomes of less than $75,000 were twice as likely to select “wanting cheaper housing” as a reason for moving. The lowest-income respondents endured the greatest loss in transit quality after moving.
Winning and Keeping Riders
A transit agency can try to adapt to some of the factors that influence ridership, even though it cannot control all of them: auto-oriented land-use patterns, population and demographic shifts, economic growth or recession, local jurisdictions that fail to build sidewalks and make transit unreachable, and longstanding national policies that provide huge hidden subsidies to private cars, transit’s primary competition. Those external factors beyond an agency’s control create a challenging environment for transit. But an effective agency will do what it can to influence them in a more positive direction by recruiting allies in government who control zoning, street design, and transportation funding.
Reliability and frequency in corridors of great demand, connectivity, stop facilities, and cleanliness are service characteristics within the agency’s power to improve, and we found that they are important factors of rider satisfaction.
The survey finds that one major factor under agency control can either build or discourage ridership: the quality of the transit service itself. Reliability and frequency in corridors of great demand, connectivity, stop facilities, and cleanliness are service characteristics within the agency’s power to improve, and we found that they are important factors of rider satisfaction. And higher satisfaction with transit (one point on a five-point scale) is associated with higher transit use: almost one extra day a month, even controlling for age, home and work location, changes in income, and other demographic and household factors.
Quicker and more reliable bus trips require that the industry and its allies in local government increase their efforts for more bus-only lanes, bus-stop balancing, transit signal priority, all-door boarding, and other measures proven to speed up buses. Proactive and data-based dispatching practices can also improve bus-system reliability. Rail can also be affected by intrusions into the transit right-of-way. Several municipalities in the Boston area have deployed “pop-up” bus-only lanes, using cones and signs to reclaim parking space for buses. There is evidence that clean-sheet bus network redesigns, where bus routes are redrawn from scratch to respond to development changes and to emphasize high-frequency routes, correlate positively with ridership gains.
Relatively quick and inexpensive initiatives, like network redesigns and pilot bus lanes, can provide the public confidence needed to win the staffing capacity and funding for bigger improvements.
To promote their commitment to ridership growth, progressive transit agencies need to assert themselves in municipal zoning and other land-use processes, which are long-term determinants of transit demand. Transit agencies that care about long-run ridership growth also must be plugged in to a city’s housing policies.
Conclusion
Transit ridership in cities is a dynamic system; “who’s on board” is always changing because of personal circumstances and the availability of other travel modes. People move to transit-friendly neighborhoods and start taking the bus or train for the first time. Some take transit often but cut back if they realize that some trips are prone to slowness or delays. People regularly buy and shed cars in response to job and household changes. And when transit doesn’t meet their needs, people adjust by using cars—private or otherwise— more often, even in traditional transit strongholds like the Chicago and New York regions. Substantial increases in driving come at the expense of traveling on other modes, and transit in particular.
This means that the task of growing ridership is actually several different, albeit related, tasks: getting more people to try transit, keeping them as customers over time (even as they get older or increase their income), providing access to enough places so that riders can keep using transit after they move homes or jobs, and doing all of this in an increasingly crowded transportation marketplace.
Despite challenges, some regions have continued to increase transit ridership or staved off decline.
For the most part, success stories are not in places where transit improvements have been confined to a few new lines. Rather, they are places where transit agencies have committed to system-wide improvements focused on key drivers of ridership.
For the most part, success stories are not in places where transit improvements have been confined to a few new lines. Rather, they are places where transit agencies have committed to system-wide improvements focused on key drivers of ridership. They are places where transit agencies have partnered with local governments to address issues like sidewalks near transit, quality shelters, development around transit, and space devoted to cars. And they are places that have used quick, modest wins to build momentum for major improvements. They are places where transit agencies have partnered with local governments to address issues like sidewalks near transit, quality shelters, development around transit, and space devoted to cars. And they are places that have used quick, modest wins to build momentum for major improvements.
Examples around the country show that reforming transit—to make it faster, more frequent, more reliable, and safer— grows ridership.
The only responsible course for public transit leaders is continuous, rider-focused service improvement and urban policy that ensures equitable, quality transit access.
